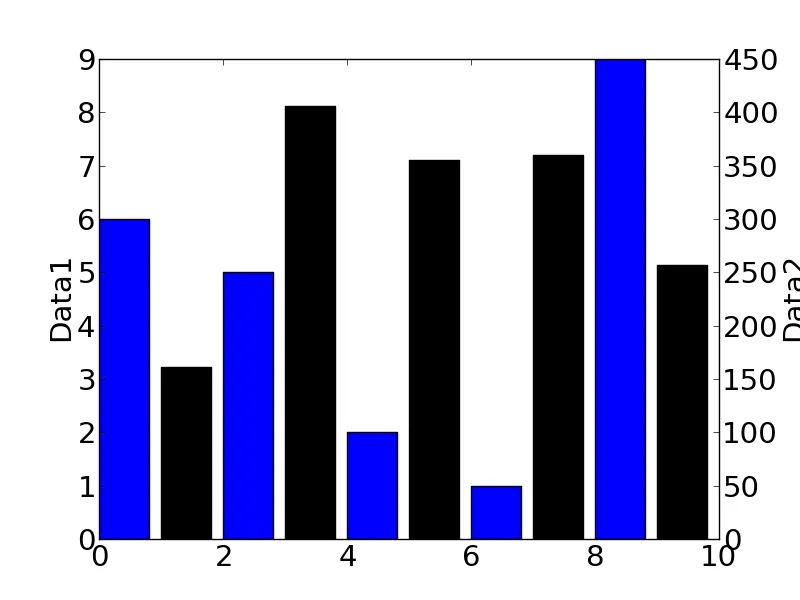
我正在使用 matplotlib 绘制一个柱状图,需要同时展示两组数据,因此我使用了 twinx() 方法来绘制两个轴。但是,第二个 y 轴的标签被裁剪了。我尝试了几种不同的方法,如使用 tight_layout()、在 rcParams 中设置 major_pad 等,但没有成功。我感觉解决方案很简单,但是我还没有找到。
这里是一个最小化工作示例:
#!/usr/bin/env python
import numpy as np
import matplotlib
matplotlib.use('Agg')
import matplotlib.pyplot as plt

matplotlib.rcParams.update({'font.size': 21})
ax = plt.gca()
plt.ylabel('Data1') #Left side
ax2 = ax.twinx()
for i in range(10):
  if(i%2==0):
    ax.bar(i,np.random.randint(10))
  else:
    ax2.bar(i,np.random.randint(1000),color='k')


plt.ylabel('Data2') #Right
侧面
plt.savefig("test.png")
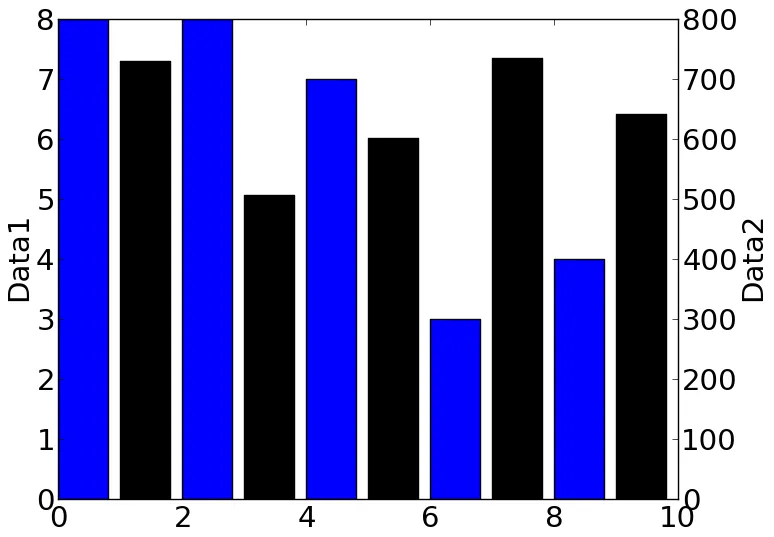
tight_layout。 - tacaswellplt.tight_layout()对我来说行不通...谢谢! - zjeplt.autoscale()也被裁剪了。我使用的是1.1.1版本,如果有帮助。 - zjeplt.tight_layout()和bbox_inches='tight'对我都起了作用。 - Suzana