带对数坐标轴的pandas直方图

6

我有一个带有时间长度数据的pandas DataFrame,单位是秒。这里的长度可以从几秒到数月不等,因此在取对数后进行直方图处理更为方便,因为它可以更好地覆盖范围。以下是示例代码:

%matplotlib inline
import numpy as np
import pandas as pd

x=np.random.lognormal(mean=10, sigma=1, size=10000)
df=pd.DataFrame(x, range(10000), columns=['timeLength'])

np.log10(df.timeLength).hist()

然而,x轴上的标签是对数刻度。有没有办法将它们放置为10 ^ 1等等。或者更好的是,如果我可以将它们放置为1秒,10秒,1分钟,10分钟,1小时,1天等。

2个回答

9

非均匀箱形图

与记录数值不同,

np.log10(df.timeLength)
尝试在计算直方图时创建非均匀分箱。这可以通过 np.histogrambins参数 实现。
基于“如果我可以将它们放置为1秒、10秒、1分钟、10分钟、1小时、1天等”,可以创建以下分箱数组。
# Bin locations (time in seconds)
bins = np.array([0, 1, 10, 60, 60*10, 60*60, 24*60*60])

例子

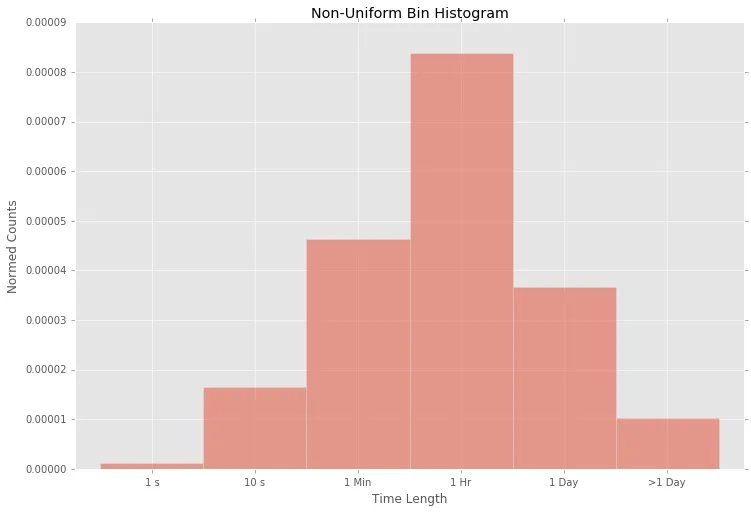
原始数据集被扩大以填充更多的箱子(平均值=5,标准差=2而不是平均值=10,标准差=1),这只是一个例子。非均匀的箱子被定义,直方图被计算并呈现出来。箱子仅供参考,可以进行修改。

# Create random data in DataFrame
x = np.random.lognormal(mean=5, sigma=2, size=10000)
df = pd.DataFrame(x, columns=['timeLength'])

print df.describe()
print

# Create non-uniform bins.  Unit in seconds.
bins = np.array([0, 1, 10, 60, 60*10, 60*60, 24*60*60])
print 'hisogram bins:', bins

# Get histogram of random data
y, x = np.histogram(df, bins=bins, normed=True)

# Correct bin placement
x = x[1:]

# Turn into pandas Series
hist = pd.Series(y, x)

# Plot
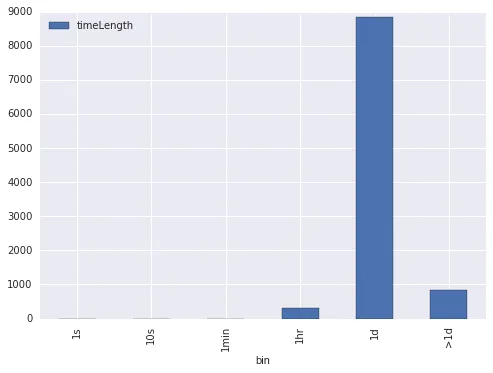
ax = hist.plot(kind='bar', width=1, alpha=0.5, align='center')
ax.set_title('Non-Uniform Bin Histogram')
ax.set_xlabel('Time Length')
ax.set_xticklabels(['1 s', '10 s', '1 Min', '1 Hr', '1 Day', '>1 Day'], rotation='horizontal')

    timeLength   
count   10000.000000
mean     1014.865417
std      4751.820312
min         0.062893
25%        36.941388
50%       144.081235
75%       556.223797
max    237838.467337

hisogram bins: [    0     1    10    60   600  3600 86400]

non-uniform bin histogram

请告知是否这不是预期结果。

1
这正是我感兴趣的内容。谢谢你提供的详细信息! - Linda

2
如果您想使用自定义的箱子,您可能需要结合pd.cut.groupby().count(),并使用一个bar图表:
x=np.random.lognormal(mean=10, sigma=1, size=10000)
df=pd.DataFrame(x, range(10000), columns=['timeLength'])

df['bin'] = pd.cut(df.timeLength,include_lowest=True, bins=[0, 1, 10, 60, 60**2, 60**2*24, df.timeLength.max()], labels=['1s', '10s', '1min', '1hr', '1d', '>1d'])
df.groupby('bin').count().plot.bar()

enter image description here


网页内容由stack overflow 提供, 点击上面的
可以查看英文原文,
原文链接