我正在尝试使用math.log(1+x)来缩放绘图的x轴,而不是通常的“log”刻度选项,并且我已经查看了一些自定义缩放示例,但我无法使我的工作!这是我的MWE:
import matplotlib.pyplot as plt
import numpy as np
import math
from matplotlib.ticker import FormatStrFormatter
from matplotlib import scale as mscale
from matplotlib import transforms as mtransforms
class CustomScale(mscale.ScaleBase):
name = 'custom'
def __init__(self, axis, **kwargs):
mscale.ScaleBase.__init__(self)
self.thresh = None #thresh
def get_transform(self):
return self.CustomTransform(self.thresh)
def set_default_locators_and_formatters(self, axis):
pass
class CustomTransform(mtransforms.Transform):
input_dims = 1
output_dims = 1
is_separable = True
def __init__(self, thresh):
mtransforms.Transform.__init__(self)
self.thresh = thresh
def transform_non_affine(self, a):
return math.log(1+a)
def inverted(self):
return CustomScale.InvertedCustomTransform(self.thresh)
class InvertedCustomTransform(mtransforms.Transform):
input_dims = 1
output_dims = 1
is_separable = True
def __init__(self, thresh):
mtransforms.Transform.__init__(self)
self.thresh = thresh
def transform_non_affine(self, a):
return math.log(1+a)
def inverted(self):
return CustomScale.CustomTransform(self.thresh)
# Now that the Scale class has been defined, it must be registered so
# that ``matplotlib`` can find it.
mscale.register_scale(CustomScale)
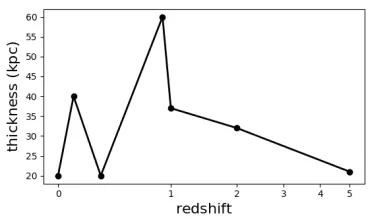
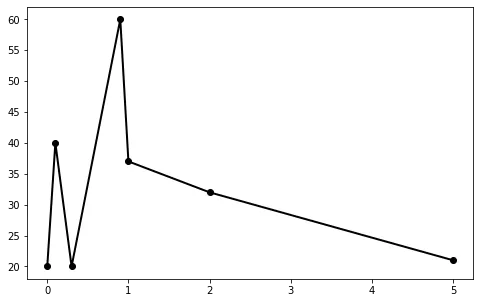
z = [0,0.1,0.3,0.9,1,2,5]
thick = [20,40,20,60,37,32,21]
fig = plt.figure(figsize=(8,5))
ax1 = fig.add_subplot(111)
ax1.plot(z, thick, marker='o', linewidth=2, c='k')
plt.xlabel(r'$\rm{redshift}$', size=16)
plt.ylabel(r'$\rm{thickness\ (kpc)}$', size=16)
plt.gca().set_xscale('custom')
plt.show()
math.log()定义了自然对数(以e为底)。您可能需要更清楚地表明您想要使用哪种对数。 - ImportanceOfBeingErnestthresh?如果删除这个在你的 MWE 中不会有影响吗? - Reinderien