我需要在帮助类中编写一个函数的代码,它将在一个图形中绘制多个直方图。使用我下面的代码,我得到了ValueError:too many values to unpack,这是由于for命令行中的变量数多于值,或者与之相反。我做错了什么?
def draw_histograms(df, variables, n_rows, n_cols):
    fig = plt.figure()
    for n_rows, n_cols, plot_number in df:
        fig.add_subplot(n_rows, n_cols, plot_number)
    plt.show()

        """ variables includes a list of variables you need to draw histograms for.
n_rows and n_cols specifies the number of subplots you need to have in a figure.
If n_rows =3 and n_cols =2, there will 3*2 = 6 subplots placed in a grid of 3 rows and 2 columns.
subplot(321) is identical to subplot(3,2,1), which refers to the 1st subplot in a grid of 3 rows and 2 columns"""

util.draw_histograms(df, variables = ['DerogCnt', 'CollectCnt', 'InqCnt06', 'InqTimeLast', 'InqFinanceCnt24', 'TLTimeFirst', 'TLTimeLast', 'TLCnt03', 'TLCnt12'], 3,3)
这是 df 的样子。由于不相关的变量已被删除,所以变量并不包括全部内容。
TARGET   ID  DerogCnt  CollectCnt  BanruptcyInd  InqCnt06  InqTimeLast  \
0       0   66         1           1             0         7            1
1       0  116         1           1             0         2            1
2       0  124         0           0             0         1            1
3       0  128         0           0             0         6            3
4       0  143         0           0             0         1            0
   InqFinanceCnt24  TLTimeFirst  TLTimeLast     ...       TL50UtilCnt  \
0                4          125           3     ...                 4
1                0          252          18     ...                 2
2                4          254          12     ...                 3
3                6          154           3     ...                 5
4                1          311          17     ...                 3

   TLBalHCPct  TLSatPct  TLDel3060Cnt24  TLDel90Cnt24  TLDel60CntAll  \
0        0.85      0.67               0             0              1
1        0.48      0.30               0             1              4
2        0.84      0.67               0             1              1
3        0.73      0.76               0             1              1
4        0.88      0.63               0             0              1

   TLOpenPct  TLBadDerogCnt  TLDel60Cnt24  TLOpen24Pct
0       0.58              0             0         0.71
1       0.40              2             1         0.50
2       0.50              1             1         0.33
3       0.53              1             1         1.22
4       0.63              0             0         0.20
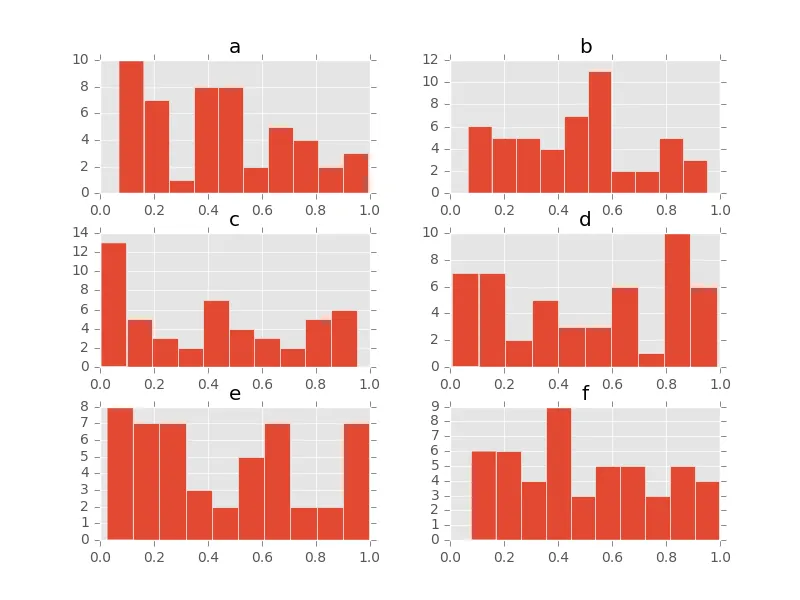
这里是