我尝试了你的更新代码,它很好地运作了。这是我正在尝试的精确内容:
import PIL
from PIL import Image
from matplotlib import pyplot as plt
im = Image.open('./color_gradient.png')
w, h = im.size
colors = im.getcolors(w*h)
def hexencode(rgb):
r=rgb[0]
g=rgb[1]
b=rgb[2]
return '#%02x%02x%02x' % (r,g,b)
for idx, c in enumerate(colors):
    plt.bar(idx, c[0], color=hexencode(c[1]))

plt.show()
更新:
我认为Matplotlib试图在每个条形图周围放置黑色边框。如果有太多的条形图,条形图会变得太细而无法呈现颜色。如果你有工具栏,你可以放大图表并查看条形图确实有颜色。因此,如果你通过以下方式设置边缘颜色:
for idx, c in enumerate(colors):
     plt.bar(idx, c[0], color=hexencode(c[1]),edgecolor=hexencode(c[1]))
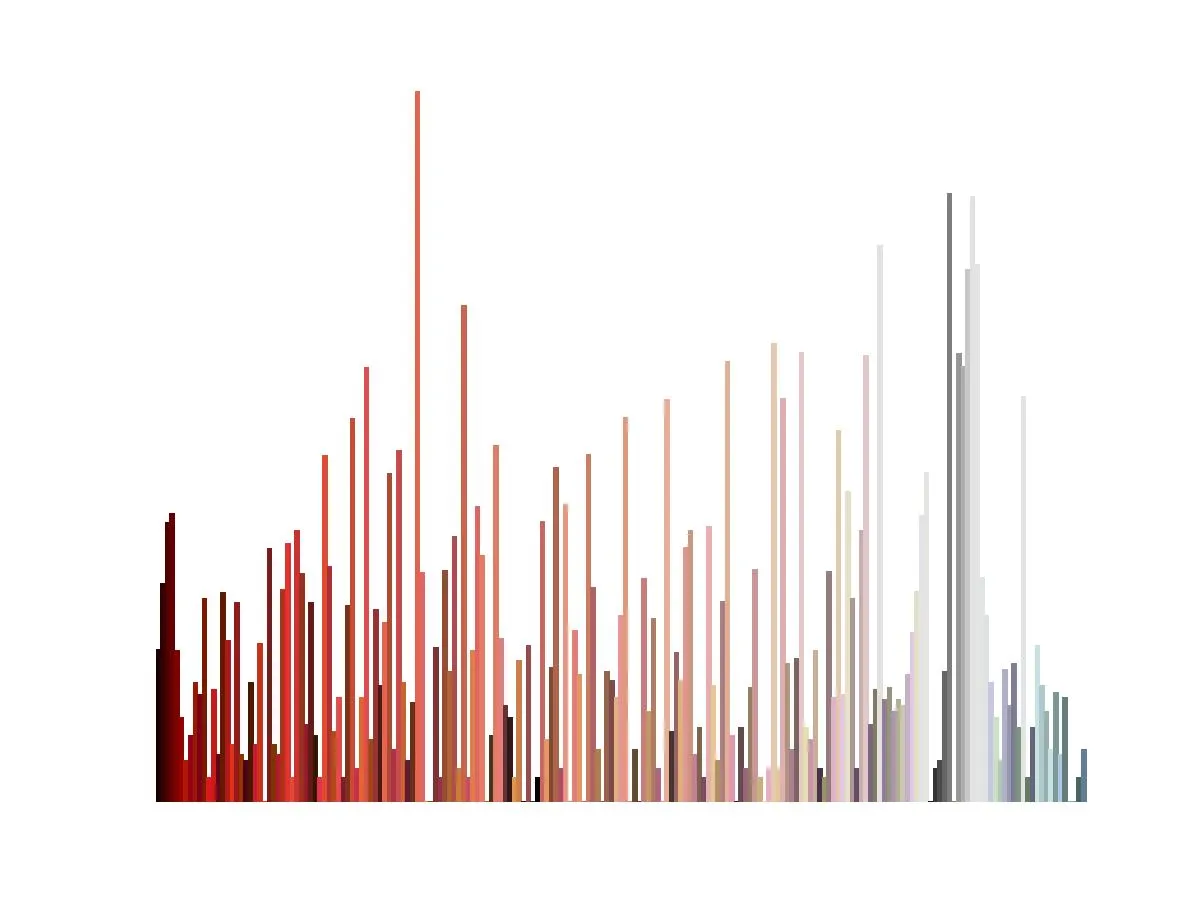
它起作用了!
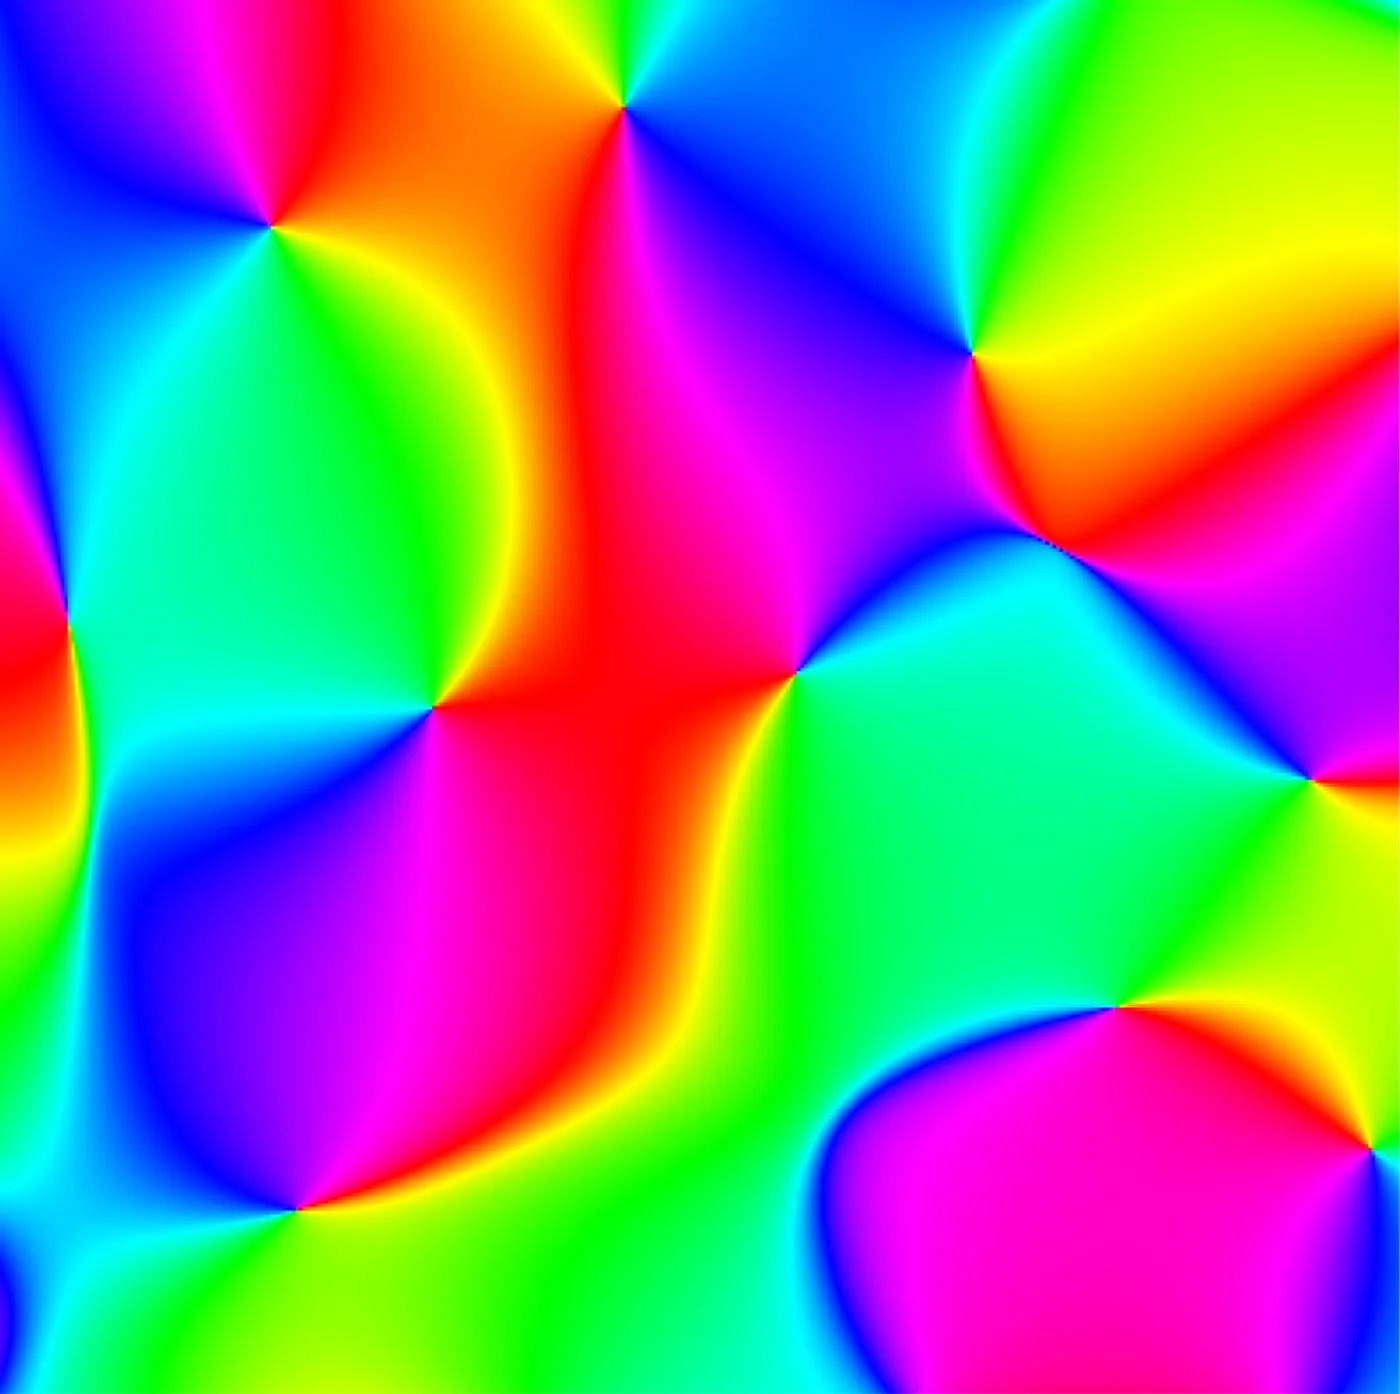
要处理的图像:
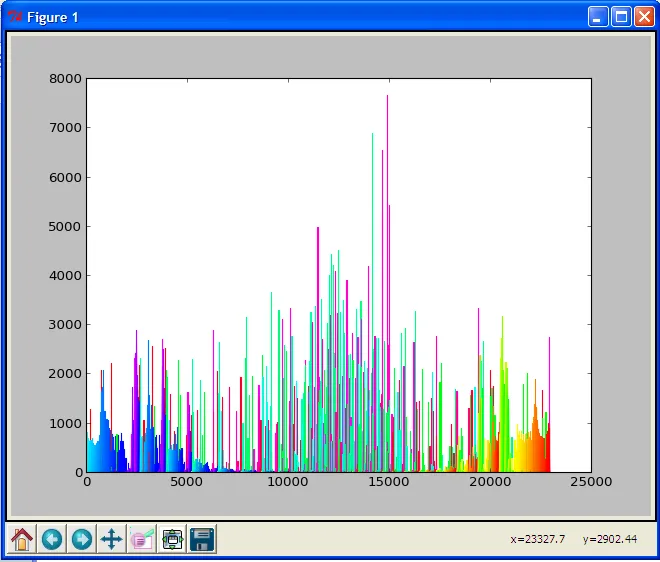
结果为:
性能分析
按tottime排序:
    ncalls  tottime  percall  cumtime  percall filename:lineno(function)
        1   23.424   23.424   24.672   24.672 {built-in method mainloop}
   460645    8.626    0.000    8.626    0.000 {numpy.core.multiarray.array}
    22941    7.909    0.000   18.447    0.001 C:\Python27\lib\site-packages\matplotlib\artist.py:805(get_aliases)
  6814123    3.900    0.000    3.900    0.000 {method 'startswith' of 'str' objects}
    22941    2.244    0.000    2.244    0.000 {dir}
   276714    2.140    0.000    2.140    0.000 C:\Python27\lib\weakref.py:243(__init__)
  4336835    2.029    0.000    2.029    0.000 {getattr}
  1927044    1.962    0.000    3.027    0.000 C:\Python27\lib\site-packages\matplotlib\artist.py:886(is_alias)
   114811    1.852    0.000    3.883    0.000 C:\Python27\lib\site-packages\matplotlib\colors.py:317(to_rgba)
    69559    1.653    0.000    2.841    0.000 C:\Python27\lib\site-packages\matplotlib\path.py:86(__init__)
    68869    1.425    0.000   11.700    0.000 C:\Python27\lib\site-packages\matplotlib\patches.py:533(_update_patch_transform)
   161205    1.316    0.000    1.618    0.000 C:\Python27\lib\site-packages\matplotlib\cbook.py:381(is_string_like)
        1    1.232    1.232    1.232    1.232 {gc.collect}
   344698    1.116    0.000    1.513    0.000 C:\Python27\lib\site-packages\matplotlib\cbook.py:372(iterable)
    22947    1.111    0.000    3.768    0.000 {built-in method draw_path}
   276692    1.024    0.000    3.164    0.000 C:\Python27\lib\site-packages\matplotlib\transforms.py:80(__init__)
        2    1.021    0.510    1.801    0.900 C:\Python27\lib\site-packages\matplotlib\colors.py:355(to_rgba_array)
    22947    0.818    0.000   14.677    0.001 C:\Python27\lib\site-packages\matplotlib\patches.py:371(draw)
183546/183539    0.793    0.000    2.030    0.000 C:\Python27\lib\site-packages\matplotlib\units.py:117(get_converter)
   138006    0.756    0.000    1.267    0.000 C:\Python27\lib\site-packages\matplotlib\transforms.py:126(set_children)
根据累计时间排序
ncalls  tottime  percall  cumtime  percall filename:lineno(function)
        1    0.001    0.001   84.923   84.923 C:\Python27\test.py:23(imageProcess)
        1    0.013    0.013   44.079   44.079 C:\Python27\lib\site-packages\matplotlib\pyplot.py:2080(bar)
        1    0.286    0.286   43.825   43.825 C:\Python27\lib\site-packages\matplotlib\axes.py:4556(bar)
        1    0.000    0.000   40.533   40.533 C:\Python27\lib\site-packages\matplotlib\pyplot.py:123(show)
        1    0.000    0.000   40.533   40.533 C:\Python27\lib\site-packages\matplotlib\backend_bases.py:69(__call__)
    22943    0.171    0.000   24.964    0.001 C:\Python27\lib\site-packages\matplotlib\patches.py:508(__init__)
        1    0.000    0.000   24.672   24.672 C:\Python27\lib\site-packages\matplotlib\backends\backend_tkagg.py:68(mainloop)
        1    0.000    0.000   24.672   24.672 C:\Python27\lib\lib-tk\Tkinter.py:323(mainloop)
        1   23.424   23.424   24.672   24.672 {built-in method mainloop}
    22947    0.499    0.000   24.654    0.001 C:\Python27\lib\site-packages\matplotlib\patches.py:55(__init__)
    22941    0.492    0.000   20.180    0.001 C:\Python27\lib\site-packages\matplotlib\artist.py:1136(setp)
    22941    0.135    0.000   18.730    0.001 C:\Python27\lib\site-packages\matplotlib\artist.py:788(__init__)
    22941    7.909    0.000   18.447    0.001 C:\Python27\lib\site-packages\matplotlib\artist.py:805(get_aliases)
    72/65    0.071    0.001   17.118    0.263 {built-in method call}
    24/12    0.000    0.000   17.095    1.425 C:\Python27\lib\lib-tk\Tkinter.py:1405(__call__)
    22941    0.188    0.000   16.647    0.001 C:\Python27\lib\site-packages\matplotlib\axes.py:1476(add_patch)
        1    0.000    0.000   15.861   15.861 C:\Python27\lib\site-packages\matplotlib\backends\backend_tkagg.py:429(show)
        1    0.000    0.000   15.861   15.861 C:\Python27\lib\lib-tk\Tkinter.py:909(update)
        1    0.000    0.000   15.846   15.846 C:\Python27\lib\site-packages\matplotlib\backends\backend_tkagg.py:219(resize)
        1    0.000    0.000   15.503   15.503 C:\Python27\lib\site-packages\matplotlib\backends\backend_tkagg.py:238(draw)
看起来大部分时间都花在了Matplotlib上。如果你想加速,可以选择找到其他绘图工具或者减少“条形”的数量。尝试使用canvas上的矩形自己动手实现。
计时:
- 发布的代码:75秒
- 为每个条形绘制一条线,如plt.plot([n,n],[0,count]等:95秒