我正在使用Python读取netcdf文件,并需要使用Python中的Matplotlib库绘制图形。
该netcdf文件包含3个变量:u,v和w分量。
我必须在垂直比例尺上绘制这3个分量。
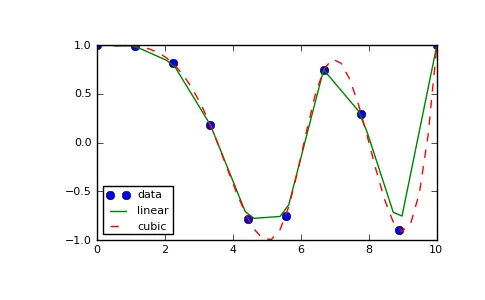
由于这些数据将用于天气预报雷达,因此需要在拐角处绘制平滑曲线。
现在的图表看起来像 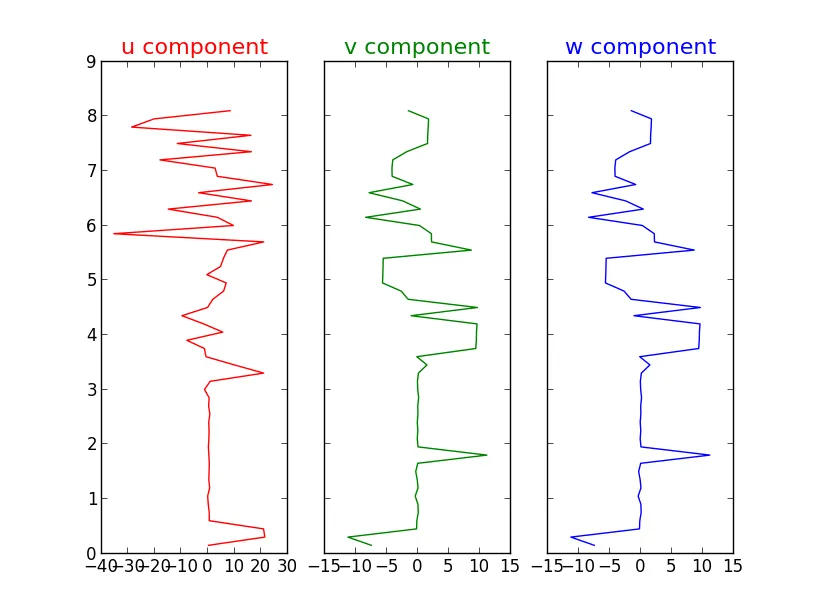 代码如下...
from netCDF4 import Dataset
from pylab import *
import numpy
from scipy import interpolate
from scipy.interpolate import spline


#passing the filename

root_grp=Dataset('C:\\Python27\\MyPrograms\\nnt206rwpuvw.nc')

#getting values of u component
temp1 = root_grp.variables['ucomponent']
data1 = temp1[:]
u=data1[0]

#getting values of v component
temp2 = root_grp.variables['wcomponent']
data2 = temp2[:]
v=data2[0]
#getting values of w component
temp3 = root_grp.variables['wcomponent']
data3 = temp3[:]
w=data3[0]
#creating a new array
array=0.15*numpy.arange(1,55).reshape(1,54)
#aliasing
y=array[0]
#sub-plots
f, (ax1, ax2, ax3) = plt.subplots(1,3, sharey=True)
ax1.plot(u,y,'r')
ax2.plot(v,y,'g')
ax3.plot(w,y,'b')
#texts
ax1.set_title('u component',fontsize=16,color='r')
ax2.set_title('v component',fontsize=16,color='g')
ax3.set_title('w component',fontsize=16,color='b')
show()