我有以下简单的脚本,用于绘制图表:
import matplotlib.pyplot as plt
import numpy as np
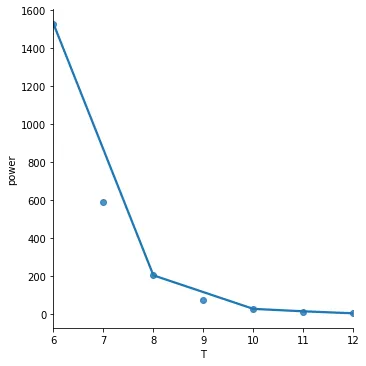
T = np.array([6, 7, 8, 9, 10, 11, 12])
power = np.array([1.53E+03, 5.92E+02, 2.04E+02, 7.24E+01, 2.72E+01, 1.10E+01, 4.70E+00])
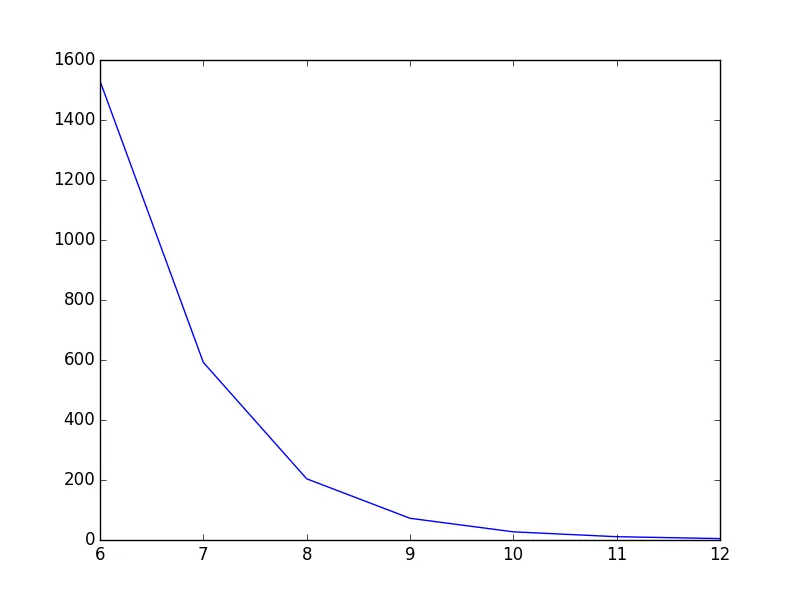
plt.plot(T,power)
plt.show()
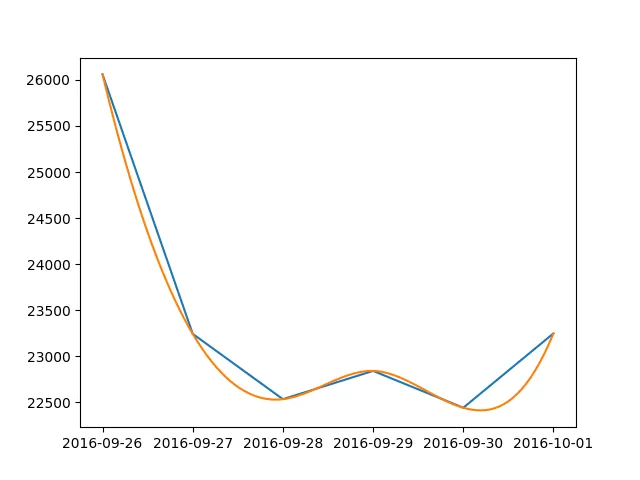
目前,这条线路直接连接每个点,看起来还不错,但我认为可以更好。我想要的是平滑连接这些点的曲线。在Gnuplot中,我会使用smooth cplines绘制。
在PyPlot中有简单的方法实现吗?我找到了一些教程,但它们似乎都很复杂。
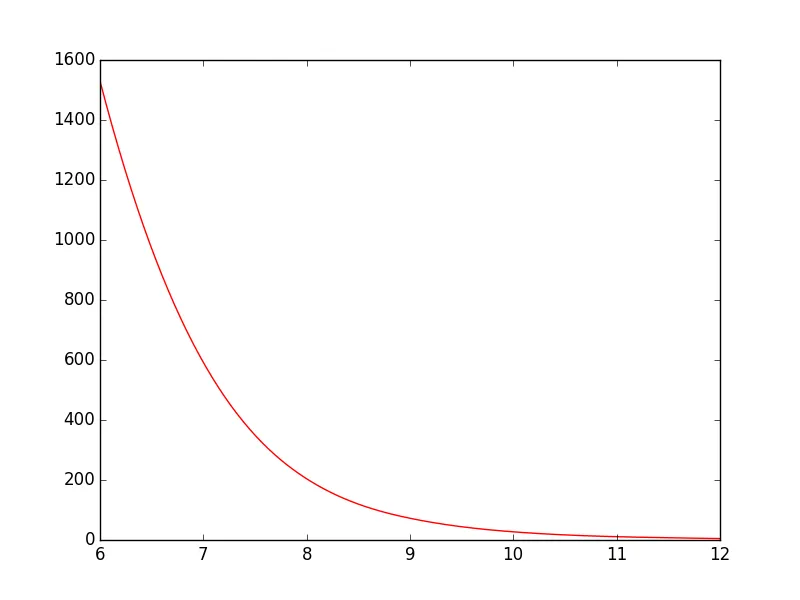
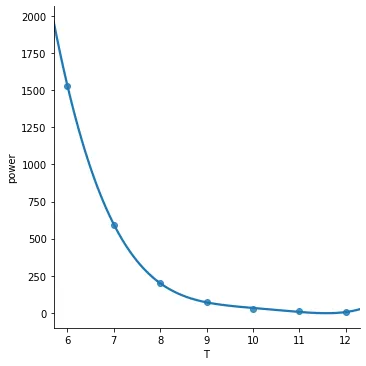
spl = make_interp_spline(T,power,k = 3) #type:BSpline对象,以便导入BSpline可以更有效地使用...或者它还需要用于其他任何事情吗?我在这里提醒一下 :) (此外,将注释稍微更改为PEP8风格也没有坏处,毕竟这是“公开代码”。) 但总的来说,感谢您的示例! - brezniczkyk=3是样条插值的插值度数:https://docs.scipy.org/doc/scipy/reference/generated/scipy.interpolate.make_interp_spline.html 。如果您使用更高的数字例如k=6,曲线应该会更加平滑。 - Jānis Lazovskis