我有
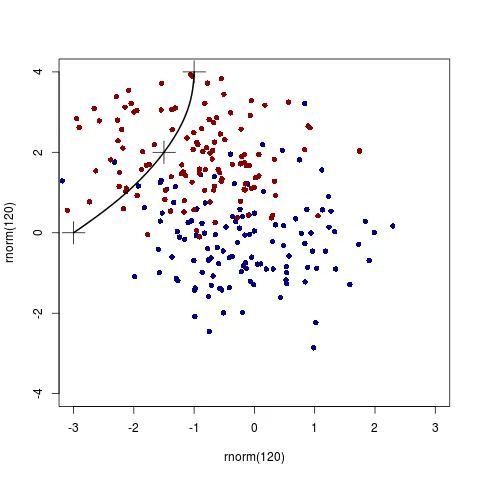
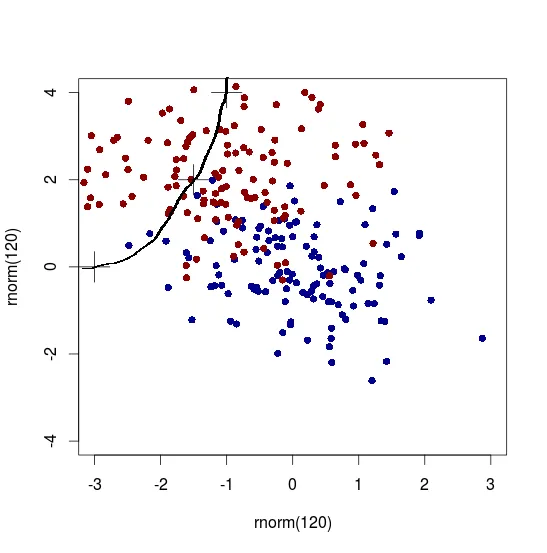
plot(rnorm(120), rnorm(120), col="darkblue", pch=16, xlim=c(-3,3), ylim=c(-4,4))
points(rnorm(120,-1,1), rnorm(120,2,1), col="darkred", pch=16)
points(c(-1,-1.5,-3), c(4,2,0), pch=3, cex=3)
 这是否可行?我知道这不是一个复杂的绘图问题,但任何基础R解决方案都可以。