如何使曲线平滑

5
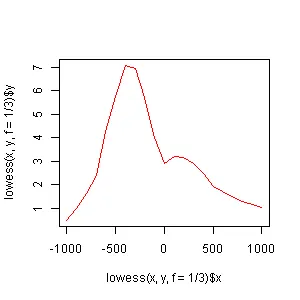
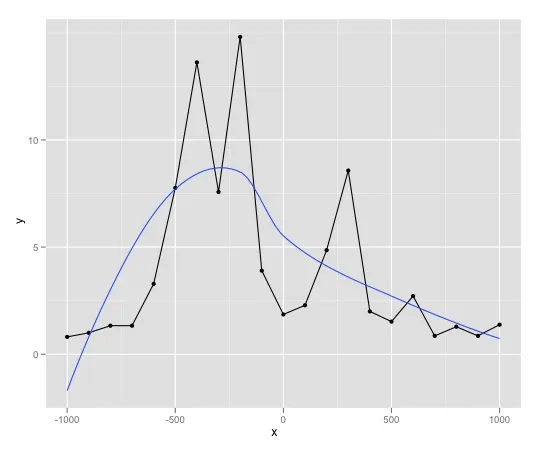
我有这样的一些数据。是否有任何方法可以让我的图表更加平滑?
cr <- colorRampPalette(col=c("red", "red", "red", "red"), bias=1)
linecols <- cr(3)
x<-c(-1000.000000,-900.000000,-800.000000,-700.000000,-600.000000,-500.000000,-400.000000,-300.000000,-200.000000,-100.000000,0.000000,100.000000,200.000000,300.000000,400.000000,500.000000,600.000000,700.000000,800.000000,900.000000,1000.000000)
y<-c(0.809524,1.000000,1.333333,1.333333,3.285714,7.761905,13.619048,7.571429,14.809524,3.904762,1.857143,2.285714,4.857143,8.571429,2.000000,1.523810,2.714286,0.857143,1.285714,0.857143,1.380952)
plot(x, y,type="l",main="Average",ylab="Average Profile",col=linecols[1],ylim=c(0.809524,14.809524),xaxt="s",yaxt="s",lwd=2)
3个回答

12
lines(x, smooth(y))

请查看?smooth.

lines(supsmu(x, y))

请看'?supsmu'。

注意,平滑处理是魔鬼的事情。


似乎 Excel 平滑处理与 ggplot 或 R 的平滑处理不同。Excel 不会改变任何形状,但是 R/ggplot 会改变形状。 - ferrelwill
2
Excel使用哪些算法?对于这个问题,你可以做的事情真的没有尽头。如果你认为这是一个问题,你应该提供一个例子。 - mdsumner

6

我同意@mdsumner的有关平滑处理的警告(互联网搜索“平滑数据不好”可以返回很多页面),但我会提供另一种解决方案:

plot(lowess(x,y,f=1/3),type="l",col="red")

请参阅 ?lowess 以获取更多信息。

输入图像描述


4
许多平滑函数可用。
这是一个平滑函数:
trace.smooth<-function(trace, type="Savitsky-Golay", width=10){

  if(type=="lowess"){
    smooth.trace<-with(clean.trace, lowess(x=1:length(trace),
                                   y=trace,
                                   f=width/length(trace),
                                   delta=width/2))$y
  }

  if(type=="moving-average"){
        moving_average<-function(width=10){
        moving.average<-rep(1,width)/width
        return(moving.average)
      }

      moving.average<-moving_average(width)

      smooth.trace<-filter(trace, moving.average)

  }

  if(type=="Savitsky-Golay"){
      # Savitsky-Golay smoothing function 
    savistsky_golay<-function(width=10){
      x<-1:width-width/2
      y<-max(x^2)-x^2
      sg<-y/sum(y)
      return(sg)
    }

    sg<-savistsky_golay(width)

      smooth.trace<-filter(trace, sg)
  }

  return(smooth.trace)
}

使用ggplot2的解决方案

library(ggplot2)

df<-data.frame(x=x, y=y)

qplot(data=df,
      x=x,
      y=y,
      geom=c("line", "point"))+
      geom_smooth(se=F)

plot with smooth

你可以在geom_smooth中添加一个方法参数(method="loess")

方法: 平滑方法(函数)的使用,例如 lm、glm、gam、loess、rlm

你可以使用stat_smooth进行微调


网页内容由stack overflow 提供, 点击上面的
可以查看英文原文,
原文链接