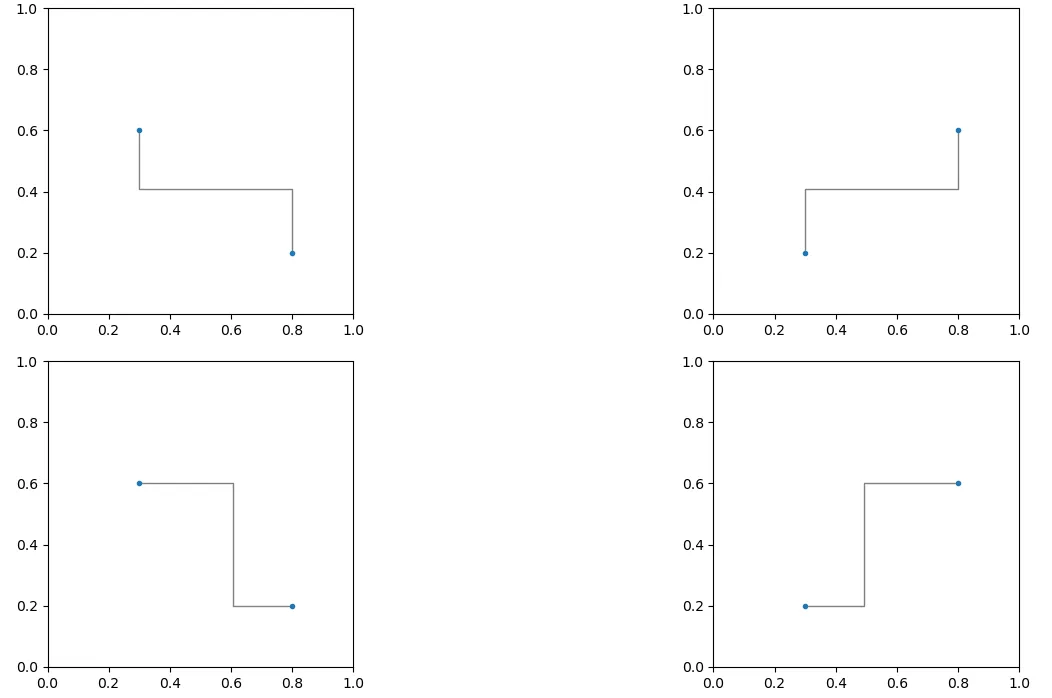
你可以通过自定义
FancyArrowPatch的
connectionstyle参数来实现这一点。文档没有很好地解释
bar的
fraction和
angle,我通过枚举将它们画出来了。
import matplotlib.pyplot as plt


x1, y1 = 0.3, 0.2
x2, y2 = 0.8, 0.6

fig, axs = plt.subplots(2, 2)

axs[0, 0].plot([x1, x2], [y2, y1], ".")
axs[0, 0].annotate("",
            xy=(x1, y2), xycoords='data',
            xytext=(x2, y1), textcoords='data',
            arrowprops=dict(arrowstyle="-", color="0.5",
                            connectionstyle="bar,angle=180,fraction=-0.3",
                            ),
            )


axs[0, 1].plot([x1, x2], [y1, y2], ".")
axs[0, 1].annotate("",
            xy=(x1, y1), xycoords='data',
            xytext=(x2, y2), textcoords='data',
            arrowprops=dict(arrowstyle="-", color="0.5",
                            connectionstyle="bar,angle=180,fraction=-0.3",
                            ),
            )

axs[1, 0].plot([x1, x2], [y2, y1], ".")
axs[1, 0].annotate("",
            xy=(x1, y2), xycoords='data',
            xytext=(x2, y1), textcoords='data',
            arrowprops=dict(arrowstyle="-", color="0.5",
                            connectionstyle="bar,angle=90,fraction=-0.3",
                            ),
            )

axs[1, 1].plot([x1, x2], [y1, y2], ".")
axs[1, 1].annotate("",
            xy=(x1, y1), xycoords='data',
            xytext=(x2, y2), textcoords='data',
            arrowprops=dict(arrowstyle="-", color="0.5",
                            connectionstyle="bar,angle=270,fraction=-0.3",
                            ),
            )

for ax in axs.flat:
    ax.set(xlim=(0, 1), ylim=(0, 1), aspect=1)

fig.tight_layout(pad=0.2)

plt.show()
请参考使用箭头进行注释和连接样式演示。
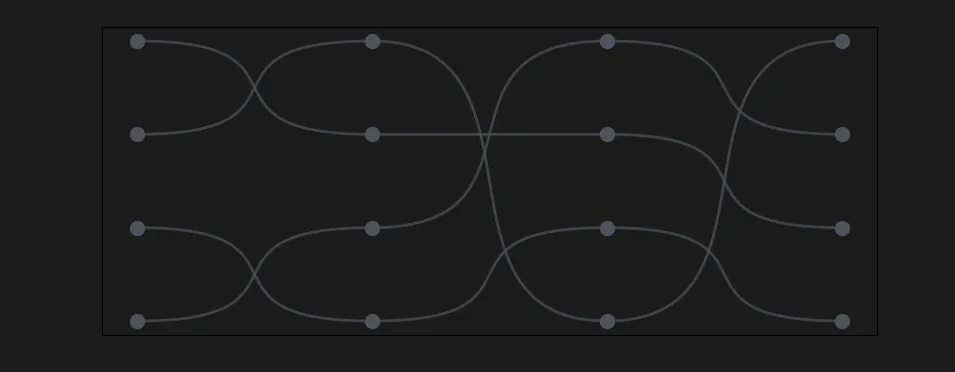
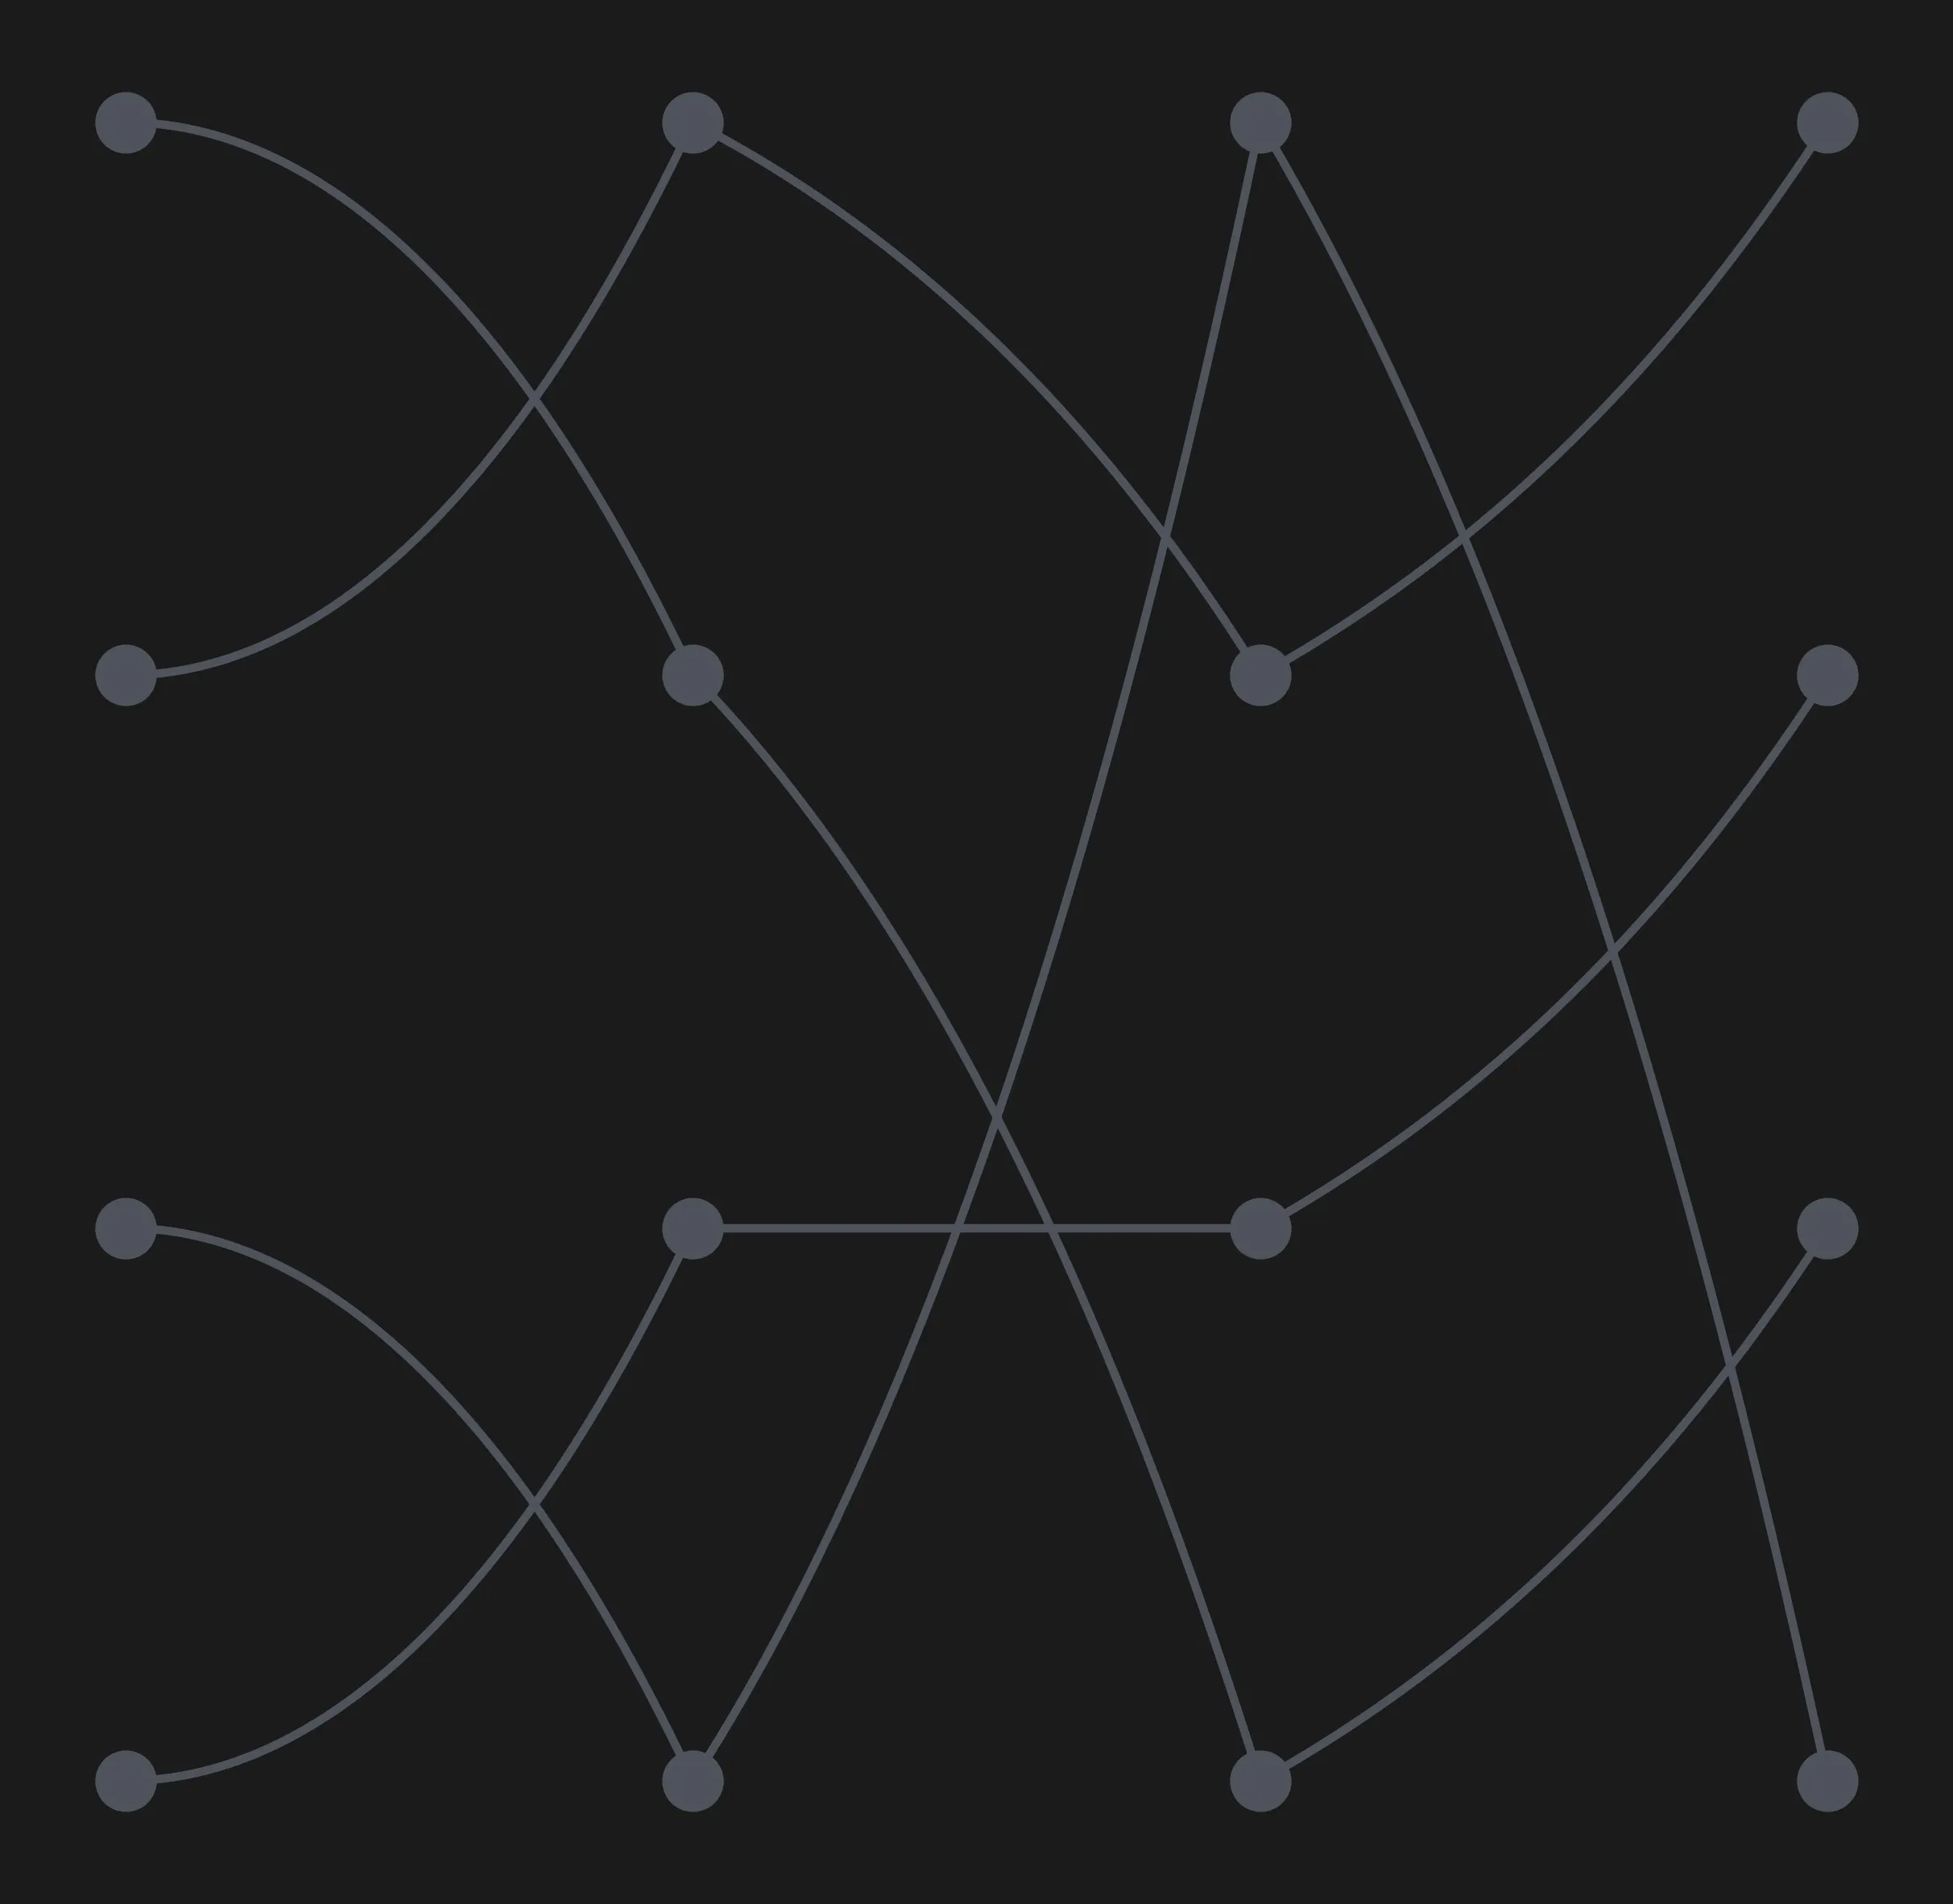
回到你的问题。我使用两个
if来判断(x1,y1)和(x2,y2)的位置,以确定它们应该使用哪种
connectionstyle。
import matplotlib.pyplot as plt
import numpy as np

n_teams = 4
n_weeks = 4

fig, ax = plt.subplots(figsize=(6,6))

t = np.array([
    [1, 2, 4, 3],
    [4, 3, 3, 2],
    [3, 4, 1, 4],
    [2, 1, 2, 1]
])

fig.patch.set_facecolor('#1b1b1b')

for nw in range(n_weeks):
    ax.scatter([nw] * n_weeks, t[:, nw], marker='o', color='#4F535C', s=100, zorder=2)

ax.axis('off')

for team in t:
    x1, x2 = 0, 1

    for rank in range(0, len(team) - 1):
        y1 = n_weeks - team[rank] + 1
        y2 = n_weeks - team[rank + 1] + 1

        if (x1 < x2 and y1 > y2):
            ax.annotate("",
                    xy=(x1, y1), xycoords='data',
                    xytext=(x2, y2), textcoords='data',
                    arrowprops=dict(arrowstyle="-", color="0.5",
                                    connectionstyle="bar,angle=180,fraction=-0.2",
                                    ),
                    )

        if (x1 < x2 and y1 < y2):
            ax.annotate("",
                        xy=(x1, y1), xycoords='data',
                        xytext=(x2, y2), textcoords='data',
                        arrowprops=dict(arrowstyle="-", color="0.5",
                                        connectionstyle="bar,angle=270,fraction=-0.4",
                                        ),
                        )

        x1 += 1
        x2 += 1

plt.show()

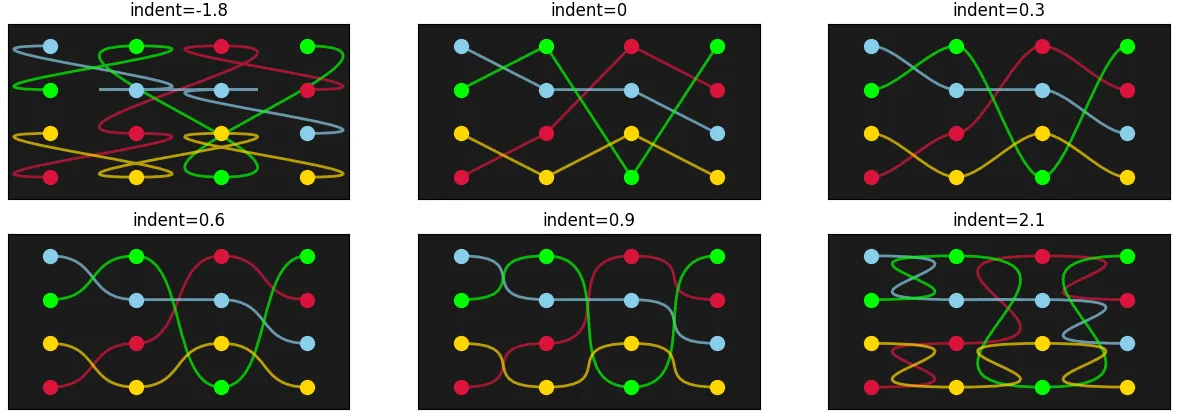
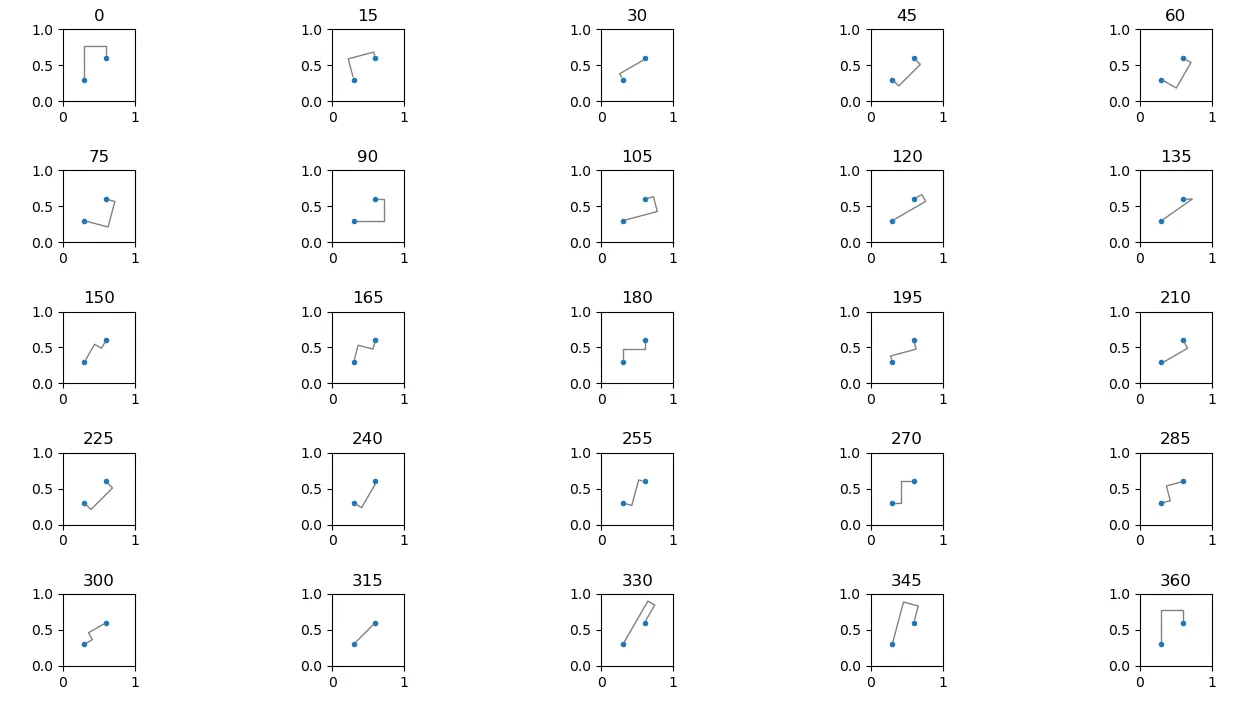
这是一个枚举的示例:
import matplotlib.pyplot as plt


x1, y1 = 0.3, 0.3
x2, y2 = 0.6, 0.6

fig, axs = plt.subplots(5, 5)

angle = 0

for ax in axs.flat:
    ax.plot([x1, x2], [y1, y2], ".")
    ax.annotate("",
                xy=(x1, y1), xycoords='data',
                xytext=(x2, y2), textcoords='data',
                arrowprops=dict(arrowstyle="-", color="0.5",
                                connectionstyle=f"bar,angle={angle},fraction=-0.3",
                                ),
                )
    ax.set_title(angle)
    angle += 15
    ax.set(xlim=(0, 1), ylim=(0, 1), aspect=1)

fig.tight_layout(pad=0.2)

plt.show()
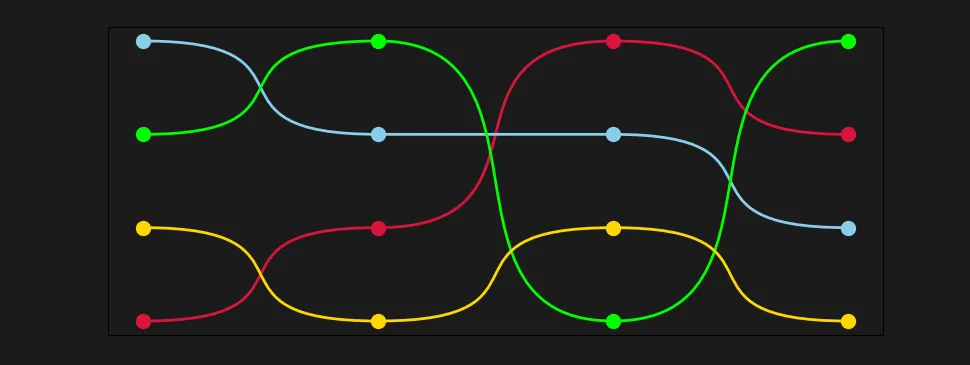
 但是我希望弯曲的线条看起来像这样:
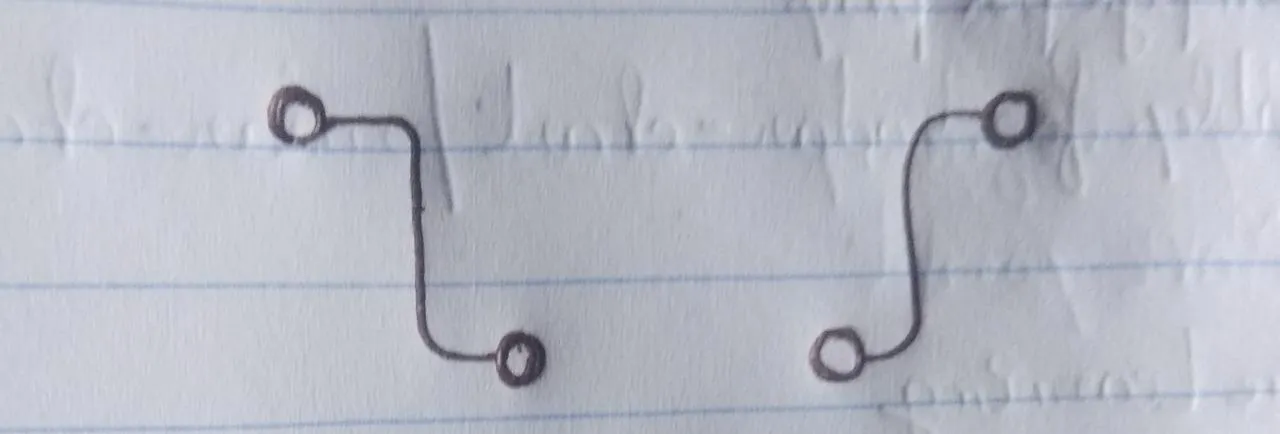 为了得到所需的结果,我需要在我的代码中做哪些更改?