如何在matplotlib中绘制三次样条曲线

6
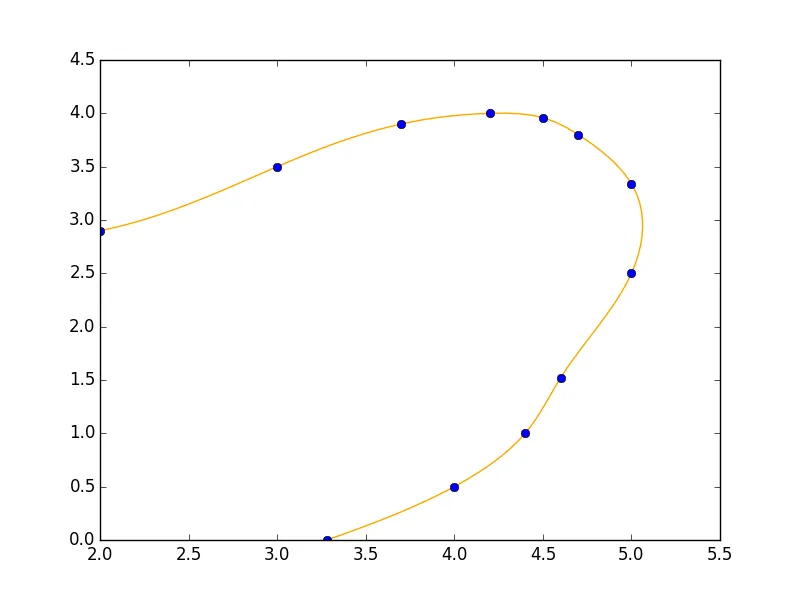
我想使用光滑线(例如三次样条曲线)连接以下points
points = [(3.28,0.00),(4.00,0.50),(4.40,1.0),(4.60,1.52),(5.00,2.5),(5.00,3.34),(4.70,3.8)]
points = points + [(4.50,3.96),(4.20,4.0),(3.70,3.90),(3.00,3.5),(2.00,2.9)]

最后,要得到像这样的橙色线(这是使用矢量绘图语言Asymptote创建的):

在Asymptote中生成的三次样条曲线

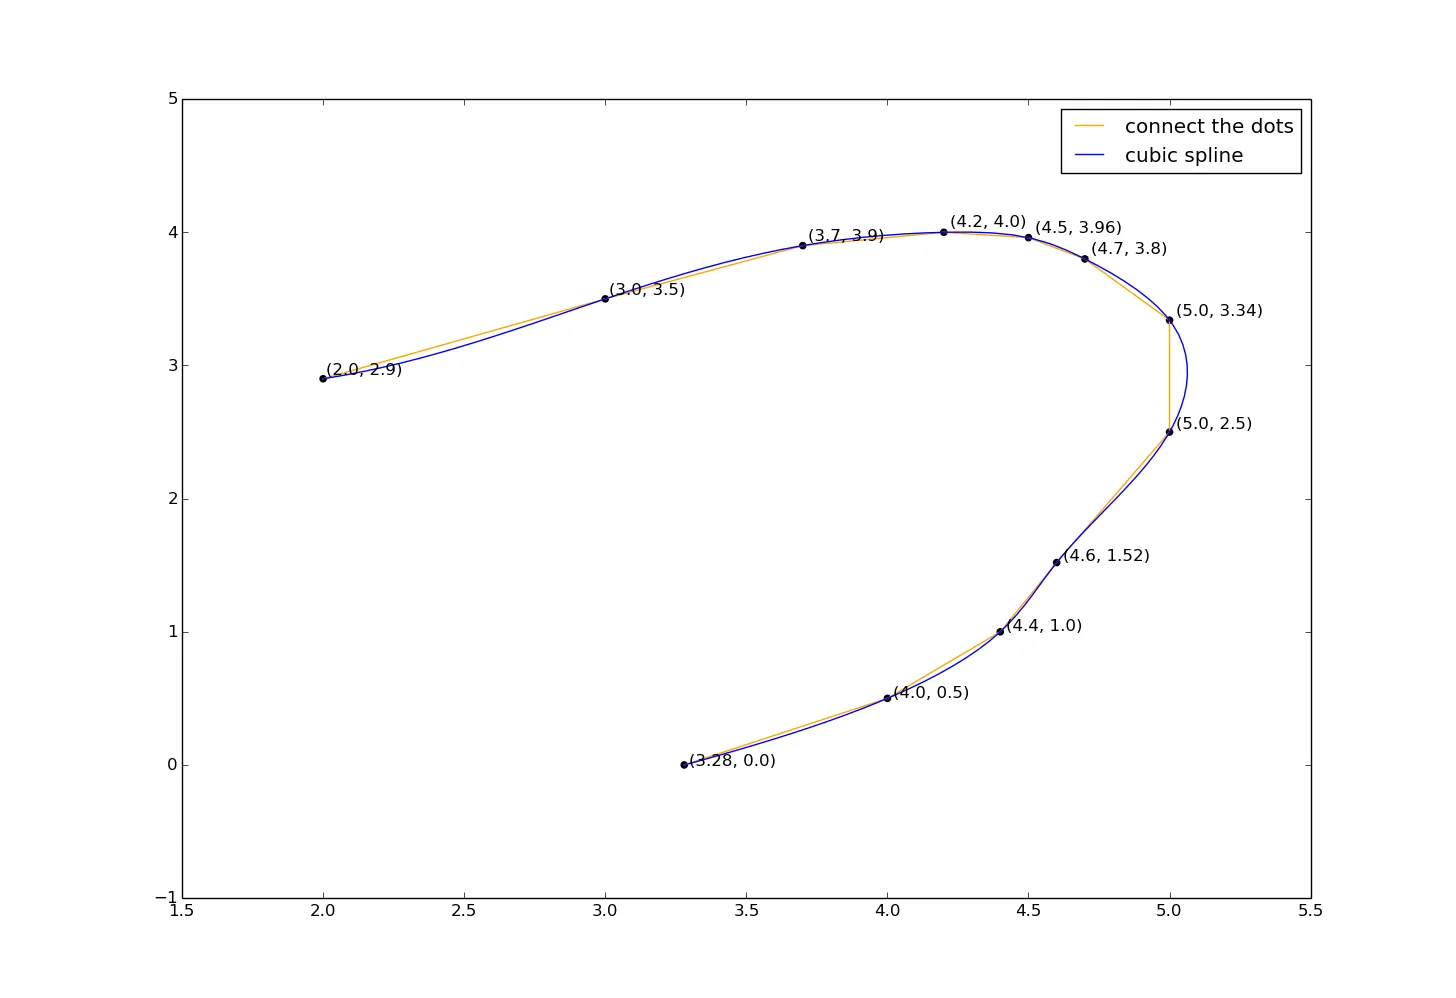
我想知道如何用简单的方法在matplotlib中实现。我已经看过类似的问题,例如Generating smooth line graph using matplotlib,但直接使用该方法会产生以下图像:

输入图像描述

这当然不是我想要的。


请参阅https://docs.scipy.org/doc/scipy/reference/tutorial/interpolate.html以获取有关插值的一般信息。 - cphlewis
2个回答

5
你需要采用参数化方法,就像这样:

enter image description here

import numpy as np
import matplotlib.pyplot as plt
from scipy import interpolate

points = [(3.28,0.00),(4.00,0.50),(4.40,1.0),(4.60,1.52),(5.00,2.5),(5.00,3.34),(4.70,3.8)]
points = points + [(4.50,3.96),(4.20,4.0),(3.70,3.90),(3.00,3.5),(2.00,2.9)]
data = np.array(points)

tck,u = interpolate.splprep(data.transpose(), s=0)
unew = np.arange(0, 1.01, 0.01)
out = interpolate.splev(unew, tck)

plt.figure()
plt.plot(out[0], out[1], color='orange')
plt.plot(data[:,0], data[:,1], 'ob')
plt.show()

这基本上只是在此处最后一个示例中重新制作 splxxx 部分的内容。


非常感谢!这正是我所需要的。 - Kevin Powell
@tom10 我喜欢你的方式。你发布得比我快一点。 - Scott

1
这基本上是按照圆形示例 此处 进行的。
import numpy as np
import matplotlib.pyplot as plt
from scipy import interpolate

def annotate_points(ax, A, B):
    for xy in zip(A, B):
        ax.annotate('(%s, %s)' % xy, xy=xy, textcoords='offset points')

points = [(3.28,0.00),(4.00,0.50),(4.40,1.0),(4.60,1.52),(5.00,2.5),(5.00,3.34),(4.70,3.8)]
points = points + [(4.50,3.96),(4.20,4.0),(3.70,3.90),(3.00,3.5),(2.00,2.9)]
x, y = zip(*points)

fig = plt.figure()
ax = fig.add_subplot(111)
plt.scatter(x, y, color='black')
annotate_points(ax, x, y)

tck,u = interpolate.splprep([x, y], s=0)
unew = np.arange(0, 1.01, 0.01)
out = interpolate.splev(unew, tck)

plt.plot(x, y, 'orange', out[0], out[1])
plt.legend(['connect the dots', 'cubic spline'])

plt.show()

enter image description here


2
@KevinPowell 很棒。我学会了如何在回答你的问题时“解压”元组列表。 - Scott

网页内容由stack overflow 提供, 点击上面的
可以查看英文原文,
原文链接