绘制阈值(precision_recall曲线)matplotlib/sklearn.metrics

5
我想绘制我的精度/召回曲线的阈值。我只是使用MNSIT数据,来自书籍《scikit-learn、keras和TensorFlow实战》中的示例。尝试训练模型以检测数字5的图像。我不知道您需要看多少代码。我已经为训练集制作了混淆矩阵,并计算了精确度和召回率值,以及阈值。我已经绘制了预测/召回曲线,但是书中的示例说要添加轴标签、图例、网格并突出显示阈值,但是代码在我放置下面的星号处截断了。我已经能够解决所有问题,除了如何在图中显示阈值。我已经包含了一张书上的图形与我所拥有的图形进行比较。这是书上的图像:
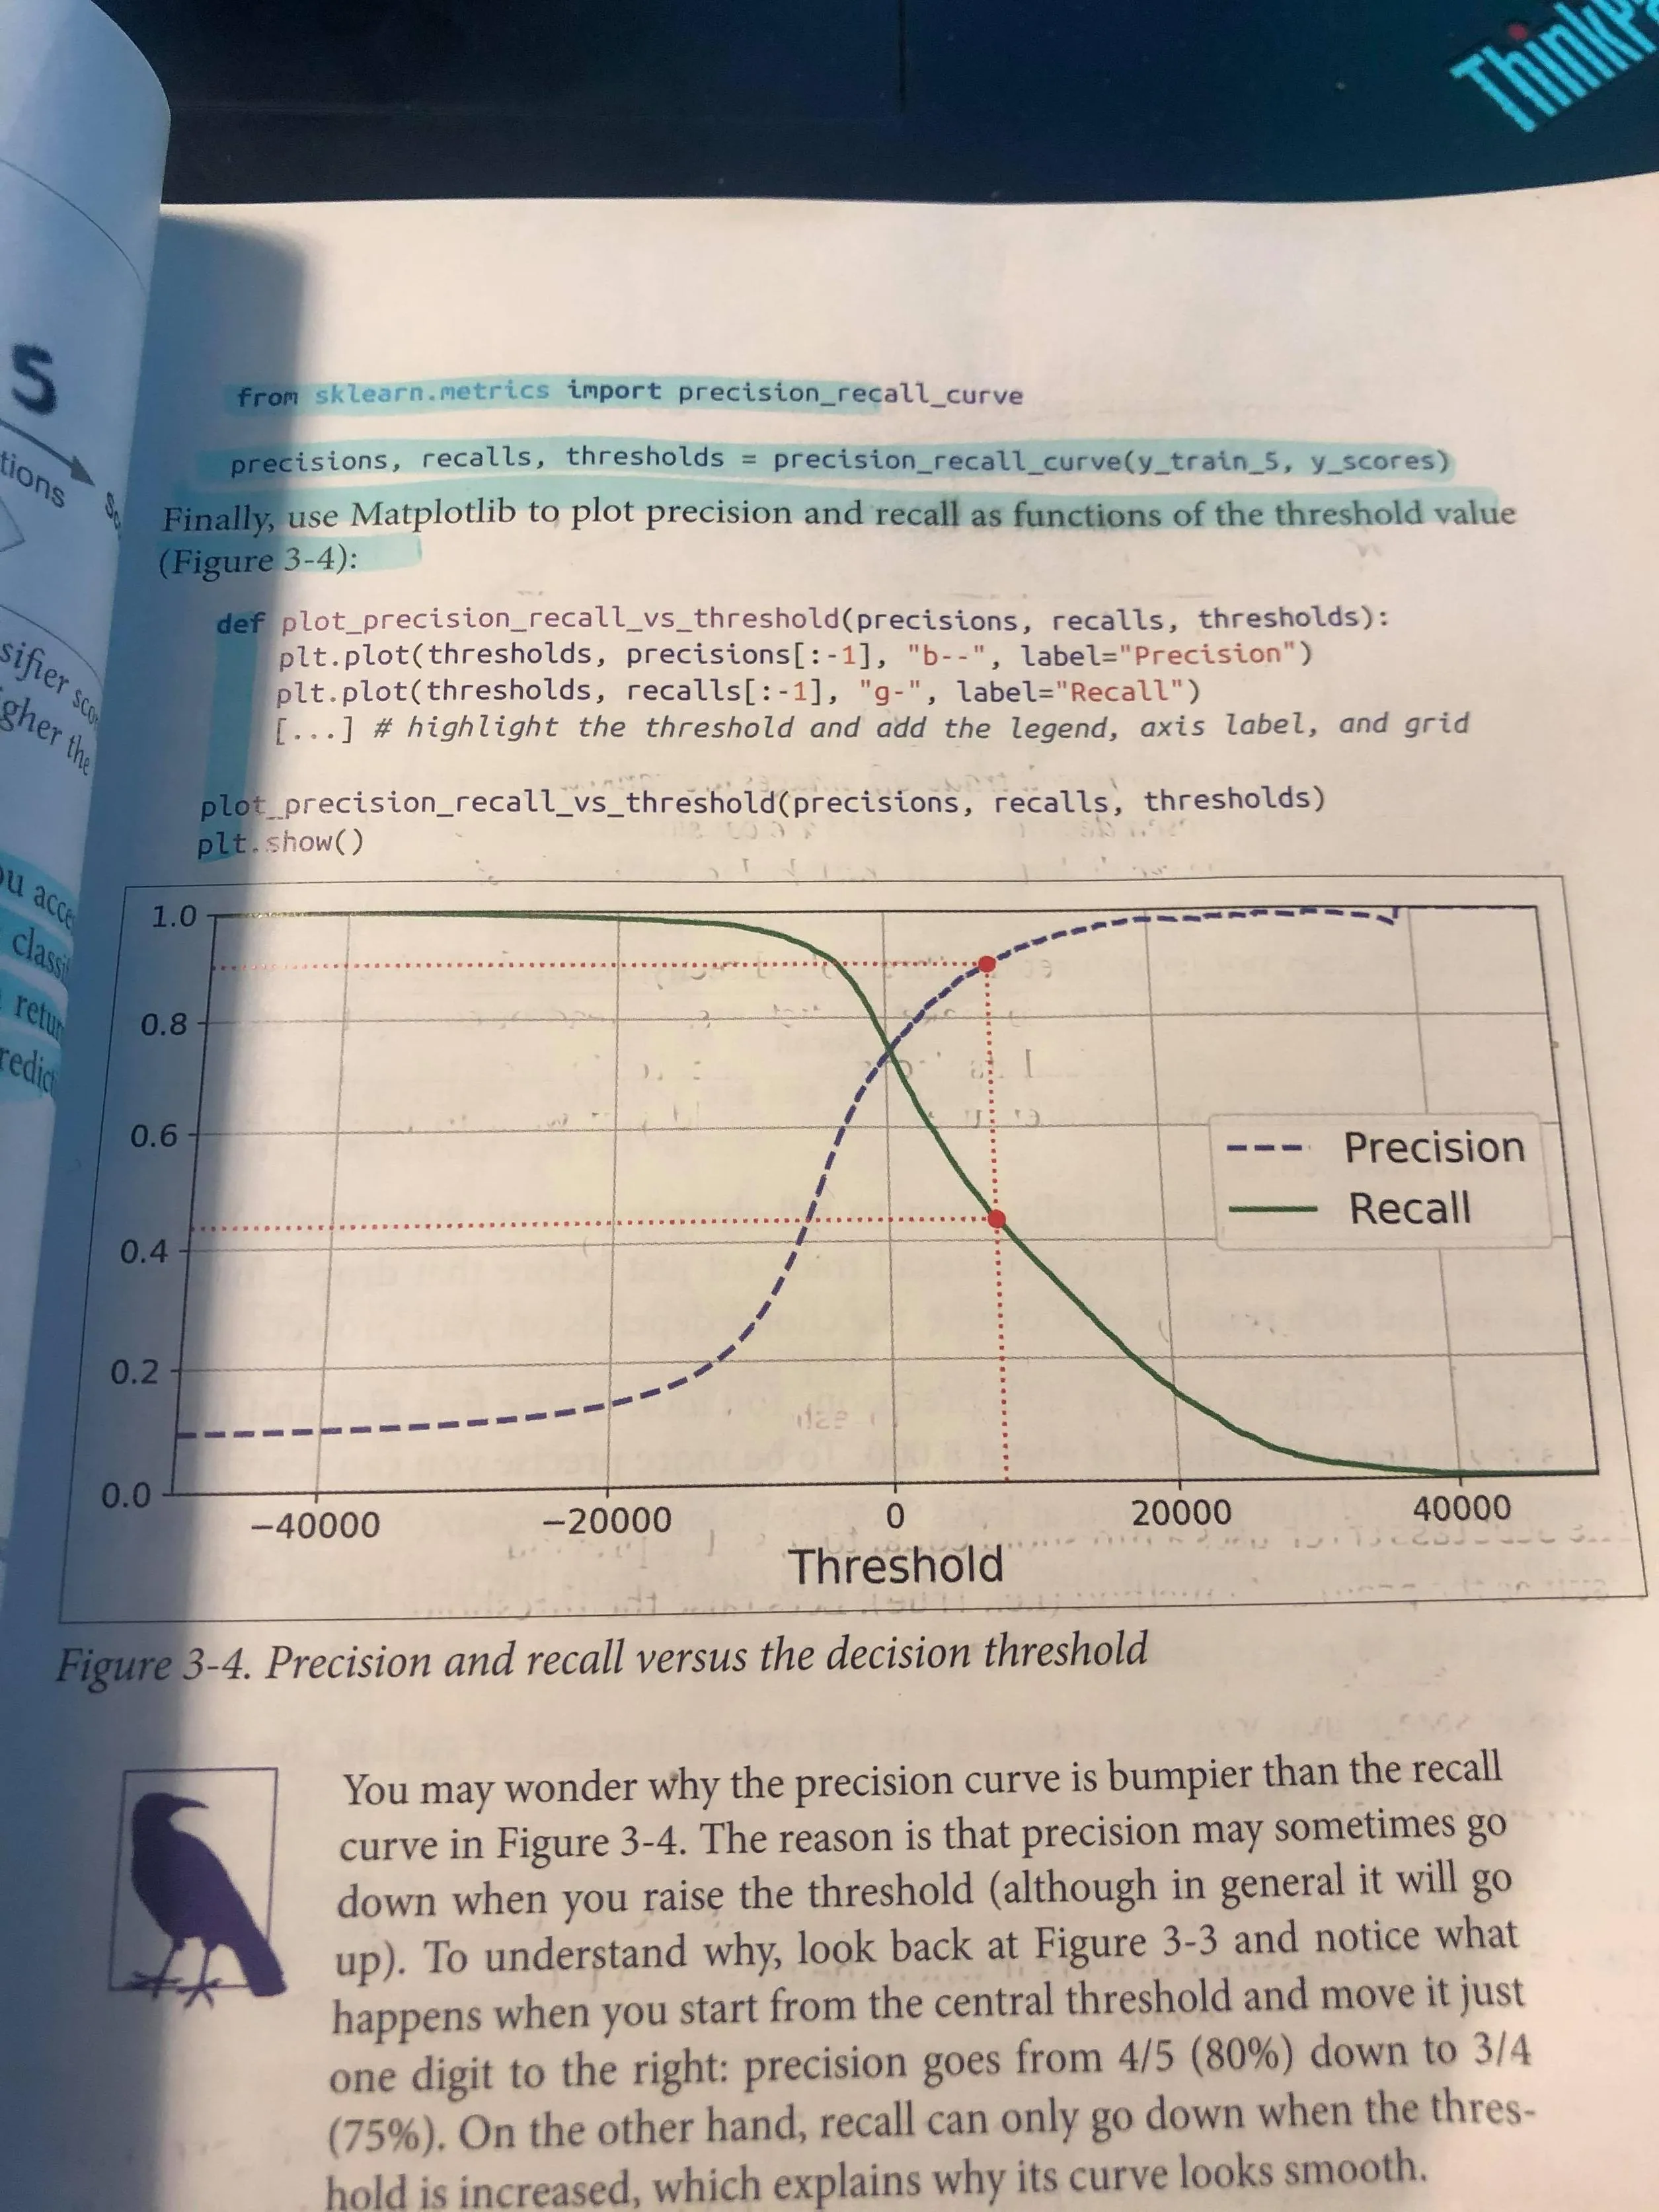
enter image description here,而这是我的图形:

enter image description here

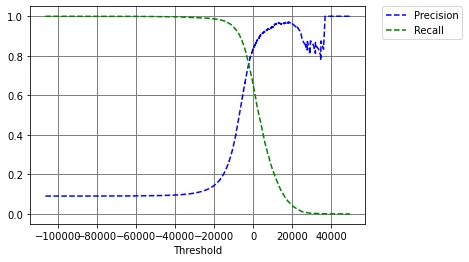
我无法让具有两个阈值点的红色虚线显示出来。有人知道我该如何做吗?以下是我的代码:

from sklearn.metrics import precision_recall_curve

precisions, recalls, thresholds = precision_recall_curve(y_train_5, y_scores)

def plot_precision_recall_vs_thresholds(precisions, recalls, thresholds):
    plt.plot(thresholds, precisions[:-1], "b--", label="Precision")
    plt.plot(thresholds, recalls[:-1], "g--", label="Recall")
    plt.xlabel("Threshold")
    plt.legend(bbox_to_anchor=(1.05, 1), loc='upper left', borderaxespad=0.)
    plt.grid(b=True, which="both", axis="both", color='gray', linestyle='-', linewidth=1)

plot_precision_recall_vs_thresholds(precisions, recalls, thresholds)
plt.show()

我知道这里有很多关于使用sklearn的问题,但似乎没有涉及如何显示那条红线。非常感谢您的帮助!


1
您可以查看如何在两个点之间绘制线条,然后指定坐标并绘制一条线。对于点,您可以使用散点图。 - Mohil Patel
2
你可以遵循提供的答案建议。我还建议查看作者提供的整个代码片段 - amiola
@amiola 谢谢你!!!这正是我正在解决的问题! - Rachel Cyr
2个回答

3
您可以使用以下代码绘制水平和垂直线:
plt.axhline(y_value, c='r', ls=':')
plt.axvline(x_value, c='r', ls=':')

1
这应该以精确的方式工作:
def plot_precision_recall_vs_threshold(precisions, recalls, thresholds):
    recall_80_precision = recalls[np.argmax(precisions >= 0.80)]
    threshold_80_precision = thresholds[np.argmax(precisions >= 0.80)]
    
    plt.plot(thresholds, precisions[:-1], "b--", label="Precision", linewidth=2)
    plt.plot(thresholds, recalls[:-1], "g-", label="Recall", linewidth=2)
    plt.xlabel("Threshold")
    plt.plot([threshold_80_precision, threshold_80_precision], [0., 0.8], "r:")
    plt.axis([-4, 4, 0, 1])
    plt.plot([-4, threshold_80_precision], [0.8, 0.8], "r:")
    plt.plot([-4, threshold_80_precision], [recall_80_precision, recall_80_precision], "r:")
    plt.plot([threshold_80_precision], [0.8], "ro") 
    plt.plot([threshold_80_precision], [recall_80_precision], "ro")
    plt.grid(True)
    plt.legend()
    plt.show()

我在尝试复制这本书中的代码时发现了这段代码。原来@ageron将所有资源都放在了他的github页面上。你可以在这里查看。

网页内容由stack overflow 提供, 点击上面的
可以查看英文原文,
原文链接