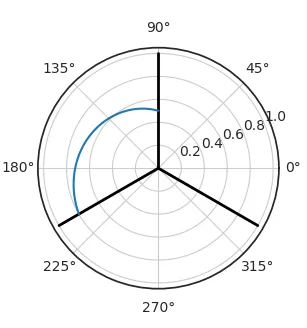
我正在尝试在极坐标图中创建连接两点之间的弧线,但我绘制的直线是直接连接这两点,而不是按极坐标方式。除了使用
ax.plot绘图函数之外,我是否需要使用其他绘图函数?我注意到matplotlib中有补丁(patch)功能,这可能是我需要使用的,但我不确定如何以这种方式添加它们。我该如何从点A到点B在极坐标图上绘制一条曲线?# Create polar plot object
with plt.style.context("seaborn-white"):
fig = plt.figure(figsize=(5,5))
ax = fig.add_subplot(111, projection="polar")
# Draw 3 lines
for degree in [90, 210, 330]:
rad = np.deg2rad(degree)
ax.plot([rad,rad], [0,1], color="black", linewidth=2)
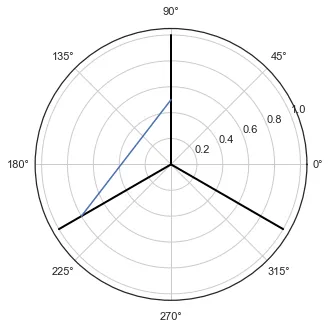
# Connect two points with a curve
for curve in [[[90, 210], [0.5, 0.8]]]:
curve[0] = np.deg2rad(curve[0])
ax.plot(curve[0], curve[1])