我正在使用以下代码创建正弦波的极坐标图。
import numpy as np
import matplotlib.pyplot as plt


theta = np.arange(0, 2*np.pi, .01)[1:]
plt.polar(theta, sin(theta))
plt.show()
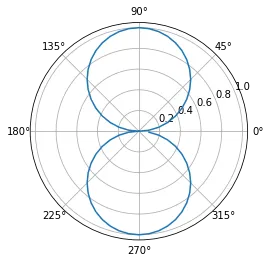
产生的结果为:
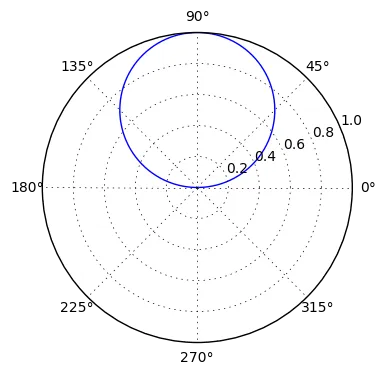
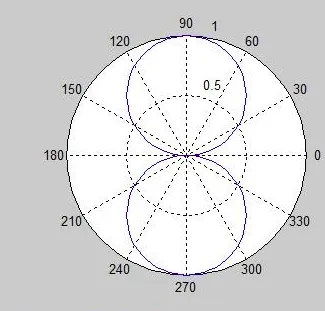
但我想对其进行对称绘制,如下所示:
我该如何得到我想要的结果?