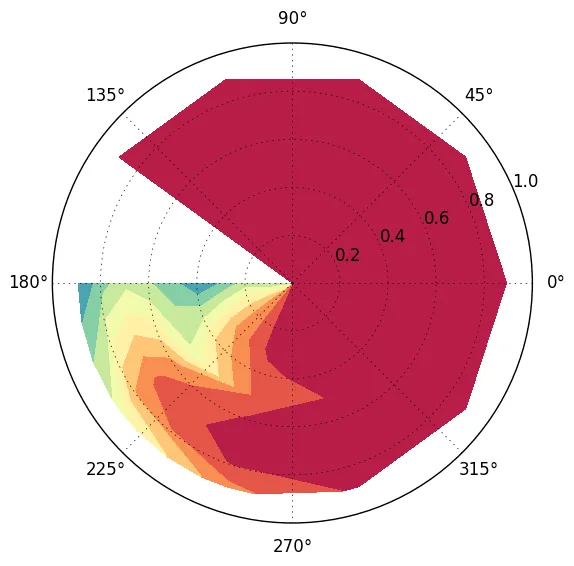
我认为解决你的问题的方法是为直方图定义bin数组(例如theta在0到2pi之间的线性间隔数组,r在0到1之间的数组)。可以使用numpy.histogram函数的bins或range参数来完成此操作。
如果这样做,请确保theta值都在0到2pi之间,方法是绘制theta %(2 * pi)而不是theta。
最后,您可以选择绘制bin边缘的中心而不是左侧,就像您的示例中所做的那样(使用0.5 *(r_edges [1:] + r_edges [:-1])而不是r_edges [:-1])。
以下是代码建议:
import matplotlib.pyplot as plt
import numpy as np
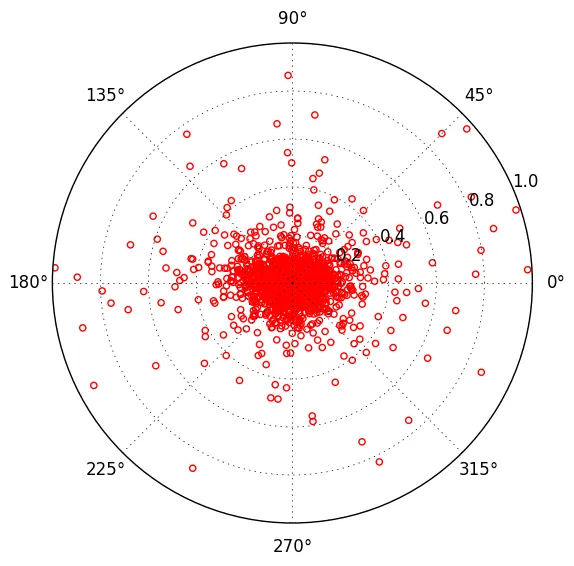
r1 = .2 + .2 * np.random.randn(200)
theta1 = 0. + np.pi / 7. * np.random.randn(len(r1))
r2 = .8 + .2 * np.random.randn(300)
theta2 = .75 * np.pi + np.pi / 7. * np.random.randn(len(r2))
r = np.concatenate((r1, r2))
theta = np.concatenate((theta1, theta2))
fig = plt.figure()
ax = plt.subplot(111, polar=True)
r_bins = np.linspace(0., 1., 12)
N_theta = 36
d_theta = 2. * np.pi / (N_theta + 1.)
theta_bins = np.linspace(-d_theta / 2., 2. * np.pi + d_theta / 2., N_theta)
H, theta_edges, r_edges = np.histogram2d(theta % (2. * np.pi), r, bins = (theta_bins, r_bins))
r_mid = .5 * (r_edges[:-1] + r_edges[1:])
theta_mid = .5 * (theta_edges[:-1] + theta_edges[1:])
cax = ax.contourf(theta_mid, r_mid, H.T, 10, cmap=plt.cm.Spectral)
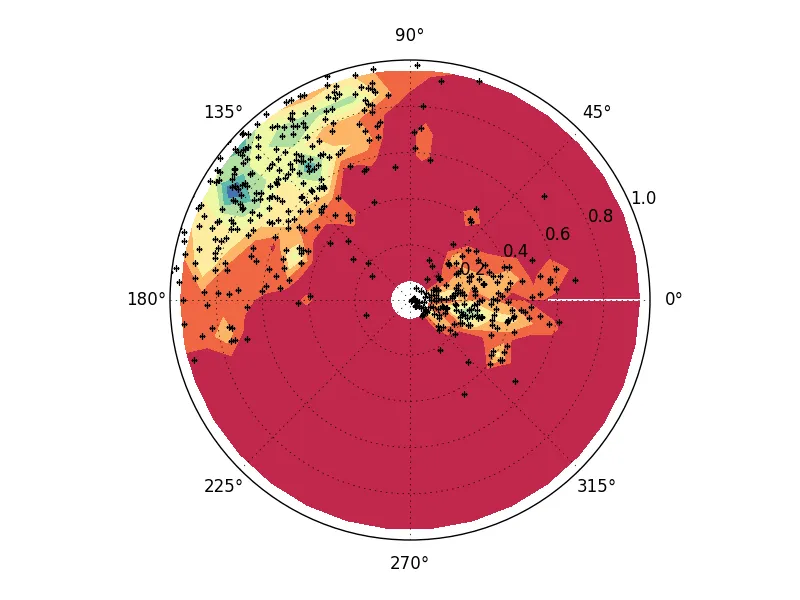
ax.scatter(theta, r, color='k', marker='+')
ax.set_rmax(1)
plt.show()
预期结果应该如下: