我正在极坐标图上绘制方位角-俯仰角曲线,其中俯仰角是径向分量。默认情况下,Matplotlib将径向值从中心0绘制到周长90。我希望相反,即90度在中心。我尝试使用ax.set_ylim(90,0)调用设置限制,但这会导致抛出LinAlgError异常。ax是从add_axes调用中获取的轴对象。
是否可以做到这一点,如果可以,我需要做什么?
编辑:这是我现在正在使用的。基本绘图代码取自Matplotlib示例之一。
这导致的结果是一个图表: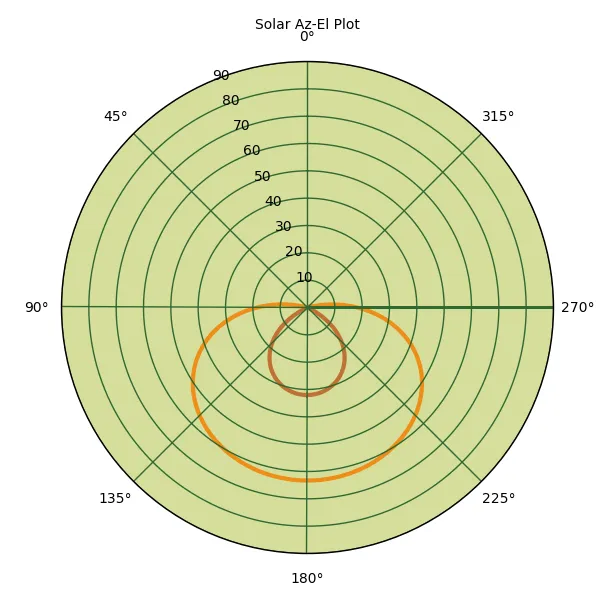
# radar green, solid grid lines
rc('grid', color='#316931', linewidth=1, linestyle='-')
rc('xtick', labelsize=10)
rc('ytick', labelsize=10)

# force square figure and square axes looks better for polar, IMO
width, height = matplotlib.rcParams['figure.figsize']
size = min(width, height)
# make a square figure
fig = figure(figsize=(size, size))
ax = fig.add_axes([0.1, 0.1, 0.8, 0.8], projection='polar', axisbg='#d5de9c')

# Adjust radius so it goes 90 at the center to 0 at the perimeter (doesn't work)
#ax.set_ylim(90, 0)

# Rotate plot so 0 degrees is due north, 180 is due south

ax.set_theta_zero_location("N")

obs.date = datetime.datetime.utcnow()
az,el = azel_calc(obs, ephem.Sun())
ax.plot(az, el, color='#ee8d18', lw=3)
obs.date = datetime.datetime.utcnow()
az,el = azel_calc(obs, ephem.Moon())
ax.plot(az, el, color='#bf7033', lw=3)

ax.set_rmax(90.)
grid(True)

ax.set_title("Solar Az-El Plot", fontsize=10)
show()
这导致的结果是一个图表: