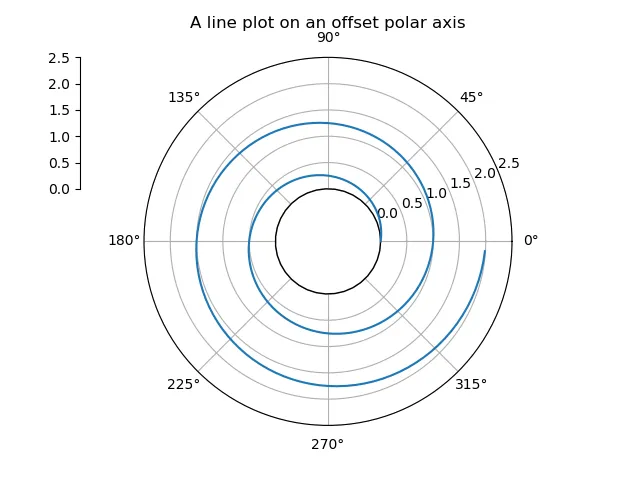
我不确定极坐标图是否可以像那样进行调整。但是,这里有一个解决方法,基于
此处给出的最后一个示例:浮动轴。
如果您复制/粘贴代码,我已经在其中包含了解释性注释,应该可以直接运行:
import mpl_toolkits.axisartist.floating_axes as floating_axes
from matplotlib.projections import PolarAxes
from mpl_toolkits.axisartist.grid_finder import FixedLocator, \
MaxNLocator, DictFormatter
import numpy as np
import matplotlib.pyplot as plt
theta = np.random.rand(100)*2.*np.pi
theta = np.sort(theta)
MAX_R = 40000.
radius = np.random.rand(100)*MAX_R
radius = radius/np.max(radius) + 1.
fig = plt.figure()
tr = PolarAxes.PolarTransform()
angle_ticks = [(0, r"$0$"),
(.25*np.pi, r"$\frac{1}{4}\pi$"),
(.5*np.pi, r"$\frac{1}{2}\pi$"),
(.75*np.pi, r"$\frac{3}{4}\pi$"),
(1.*np.pi, r"$\pi$"),
(1.25*np.pi, r"$\frac{5}{4}\pi$"),
(1.5*np.pi, r"$\frac{3}{2}\pi$"),
(1.75*np.pi, r"$\frac{7}{4}\pi$")]
grid_locator1 = FixedLocator([v for v, s in angle_ticks])
tick_formatter1 = DictFormatter(dict(angle_ticks))
radius_ticks = [(1., '0.0'),
(1.5, '%i' % (MAX_R/2.)),
(2.0, '%i' % (MAX_R))]
grid_locator2 = FixedLocator([v for v, s in radius_ticks])
tick_formatter2 = DictFormatter(dict(radius_ticks))
grid_helper = floating_axes.GridHelperCurveLinear(tr,
extremes=(2.*np.pi, 0, 2, 1),
grid_locator1=grid_locator1,
grid_locator2=grid_locator2,
tick_formatter1=tick_formatter1,
tick_formatter2=tick_formatter2)
ax1 = floating_axes.FloatingSubplot(fig, 111, grid_helper=grid_helper)
fig.add_subplot(ax1)
aux_ax = ax1.get_aux_axes(tr)
aux_ax.patch = ax1.patch
ax1.patch.zorder=0.9
aux_ax.plot(theta, radius)
plt.show()
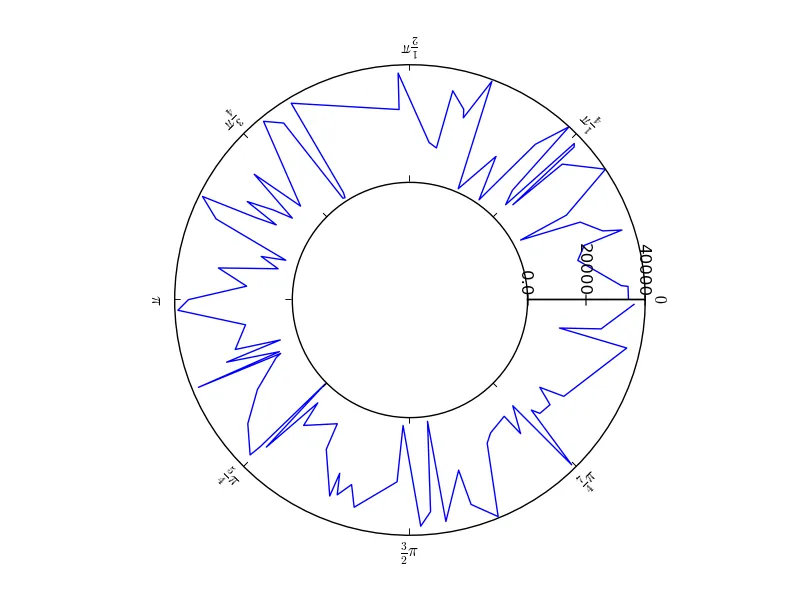
这将生成以下图表:
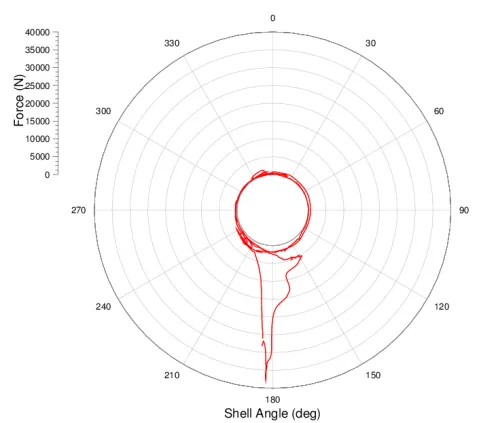
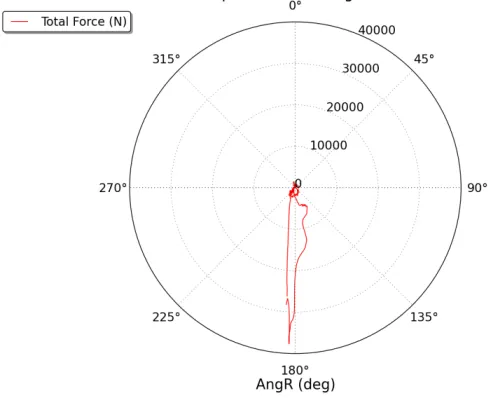
您需要微调轴标签以满足您的要求。我进行了数据缩放,否则与您的绘图相同的问题会发生——内部空白圆将被缩放为点。您可以尝试对极坐标图进行缩放,并在径向轴上放置自定义标签以实现类似的效果。