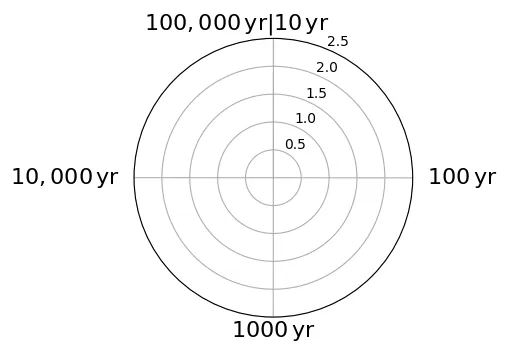
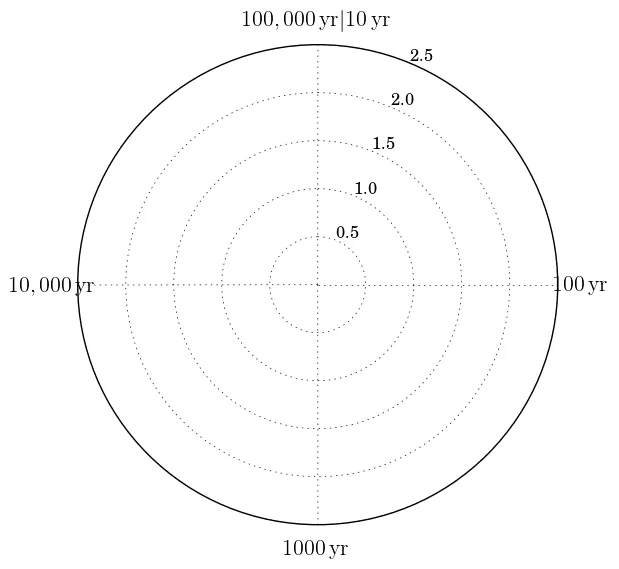
我在这个图中遇到了定位坐标轴标签的问题。我希望将顶部标签的位置调整到与网格对齐,而左右两侧的标签则不接触图表。
我尝试过:
ax.tick_params(axis='both', which='both', pad=15)
但是它没有任何效果。此外,
rcParams
看起来与图的对数比例尺有冲突。作为一个hack,我尝试使用空格,但LaTeX在每个单词的开头和结尾被剥离了。最后,我尝试了不可见的Unicode符号,但只让matplotlib崩溃了。
非常感谢您的帮助!
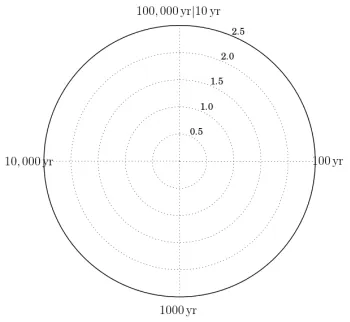
import numpy
from matplotlib import pyplot as plt
ax = plt.subplot(111, polar=True)
plt.rc('text', usetex=True)
plt.rc('font', family='serif')
ax.set_xticks(numpy.linspace(0, 2 * 3.14, 4, endpoint=False))
ax.set_theta_direction(-1)
ax.set_theta_offset(3.14 / 2.0)
plt.ylim(0, 2.5)
ax.set_xticklabels([
    r'$100,000\,{\rm yr}|10\,{\rm yr}$',
    r'$100\,{\rm yr}$',
    r'$1000\,{\rm yr}$',
    r'$10,000\,{\rm yr}$'],
    fontsize=16)
plt.show()