我在matplotlib中有一个极坐标轴,其文本超出了轴的范围。我想要删除轴的边框 - 或将其设置为背景颜色,以使文本更易读。我该怎么做?
简单地增加轴的大小不是可接受的解决方案(因为该图可以嵌入GUI中,如果这样做,它会变得太小)。将背景颜色更改为黑色,以使边框不可见也不是可接受的解决方案。
import pylab as pl
fig = pl.figure(figsize=(5,5), facecolor='white')
axes = pl.subplot(111, polar=True, axisbg='white')

pl.xticks([])
pl.yticks([])
pl.ylim(0,10)

# ... draw lots of things
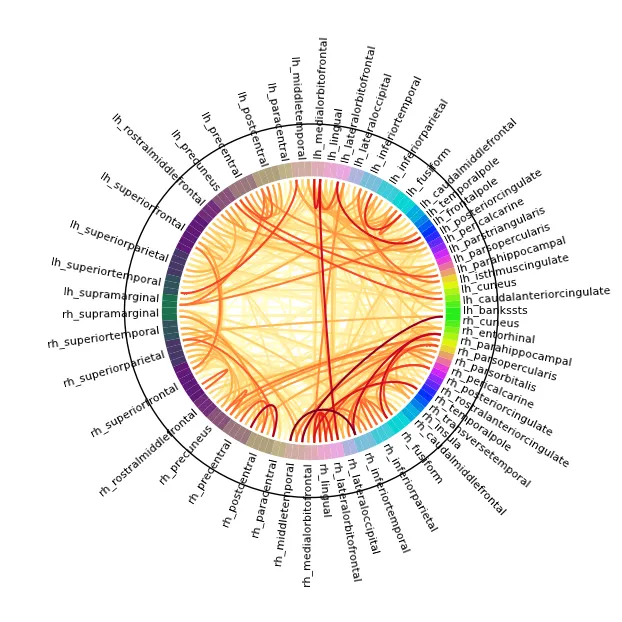
NME包制作的循环关系图吗?https://martinos.org/mne/stable/auto_examples/connectivity/plot_mne_inverse_label_connectivity.html - CT Zhu