我正在使用Matplotlib为大学项目制作极地散点图,但我不知道如何在径向轴上添加标签。这是我的代码(因为数据是从CSV中读取的,所以我省略了它)
import matplotlib.pyplot as plt
ax = plt.subplot(111, polar=True)
ax.set_rmax(1)
c = plt.scatter(theta, radii)
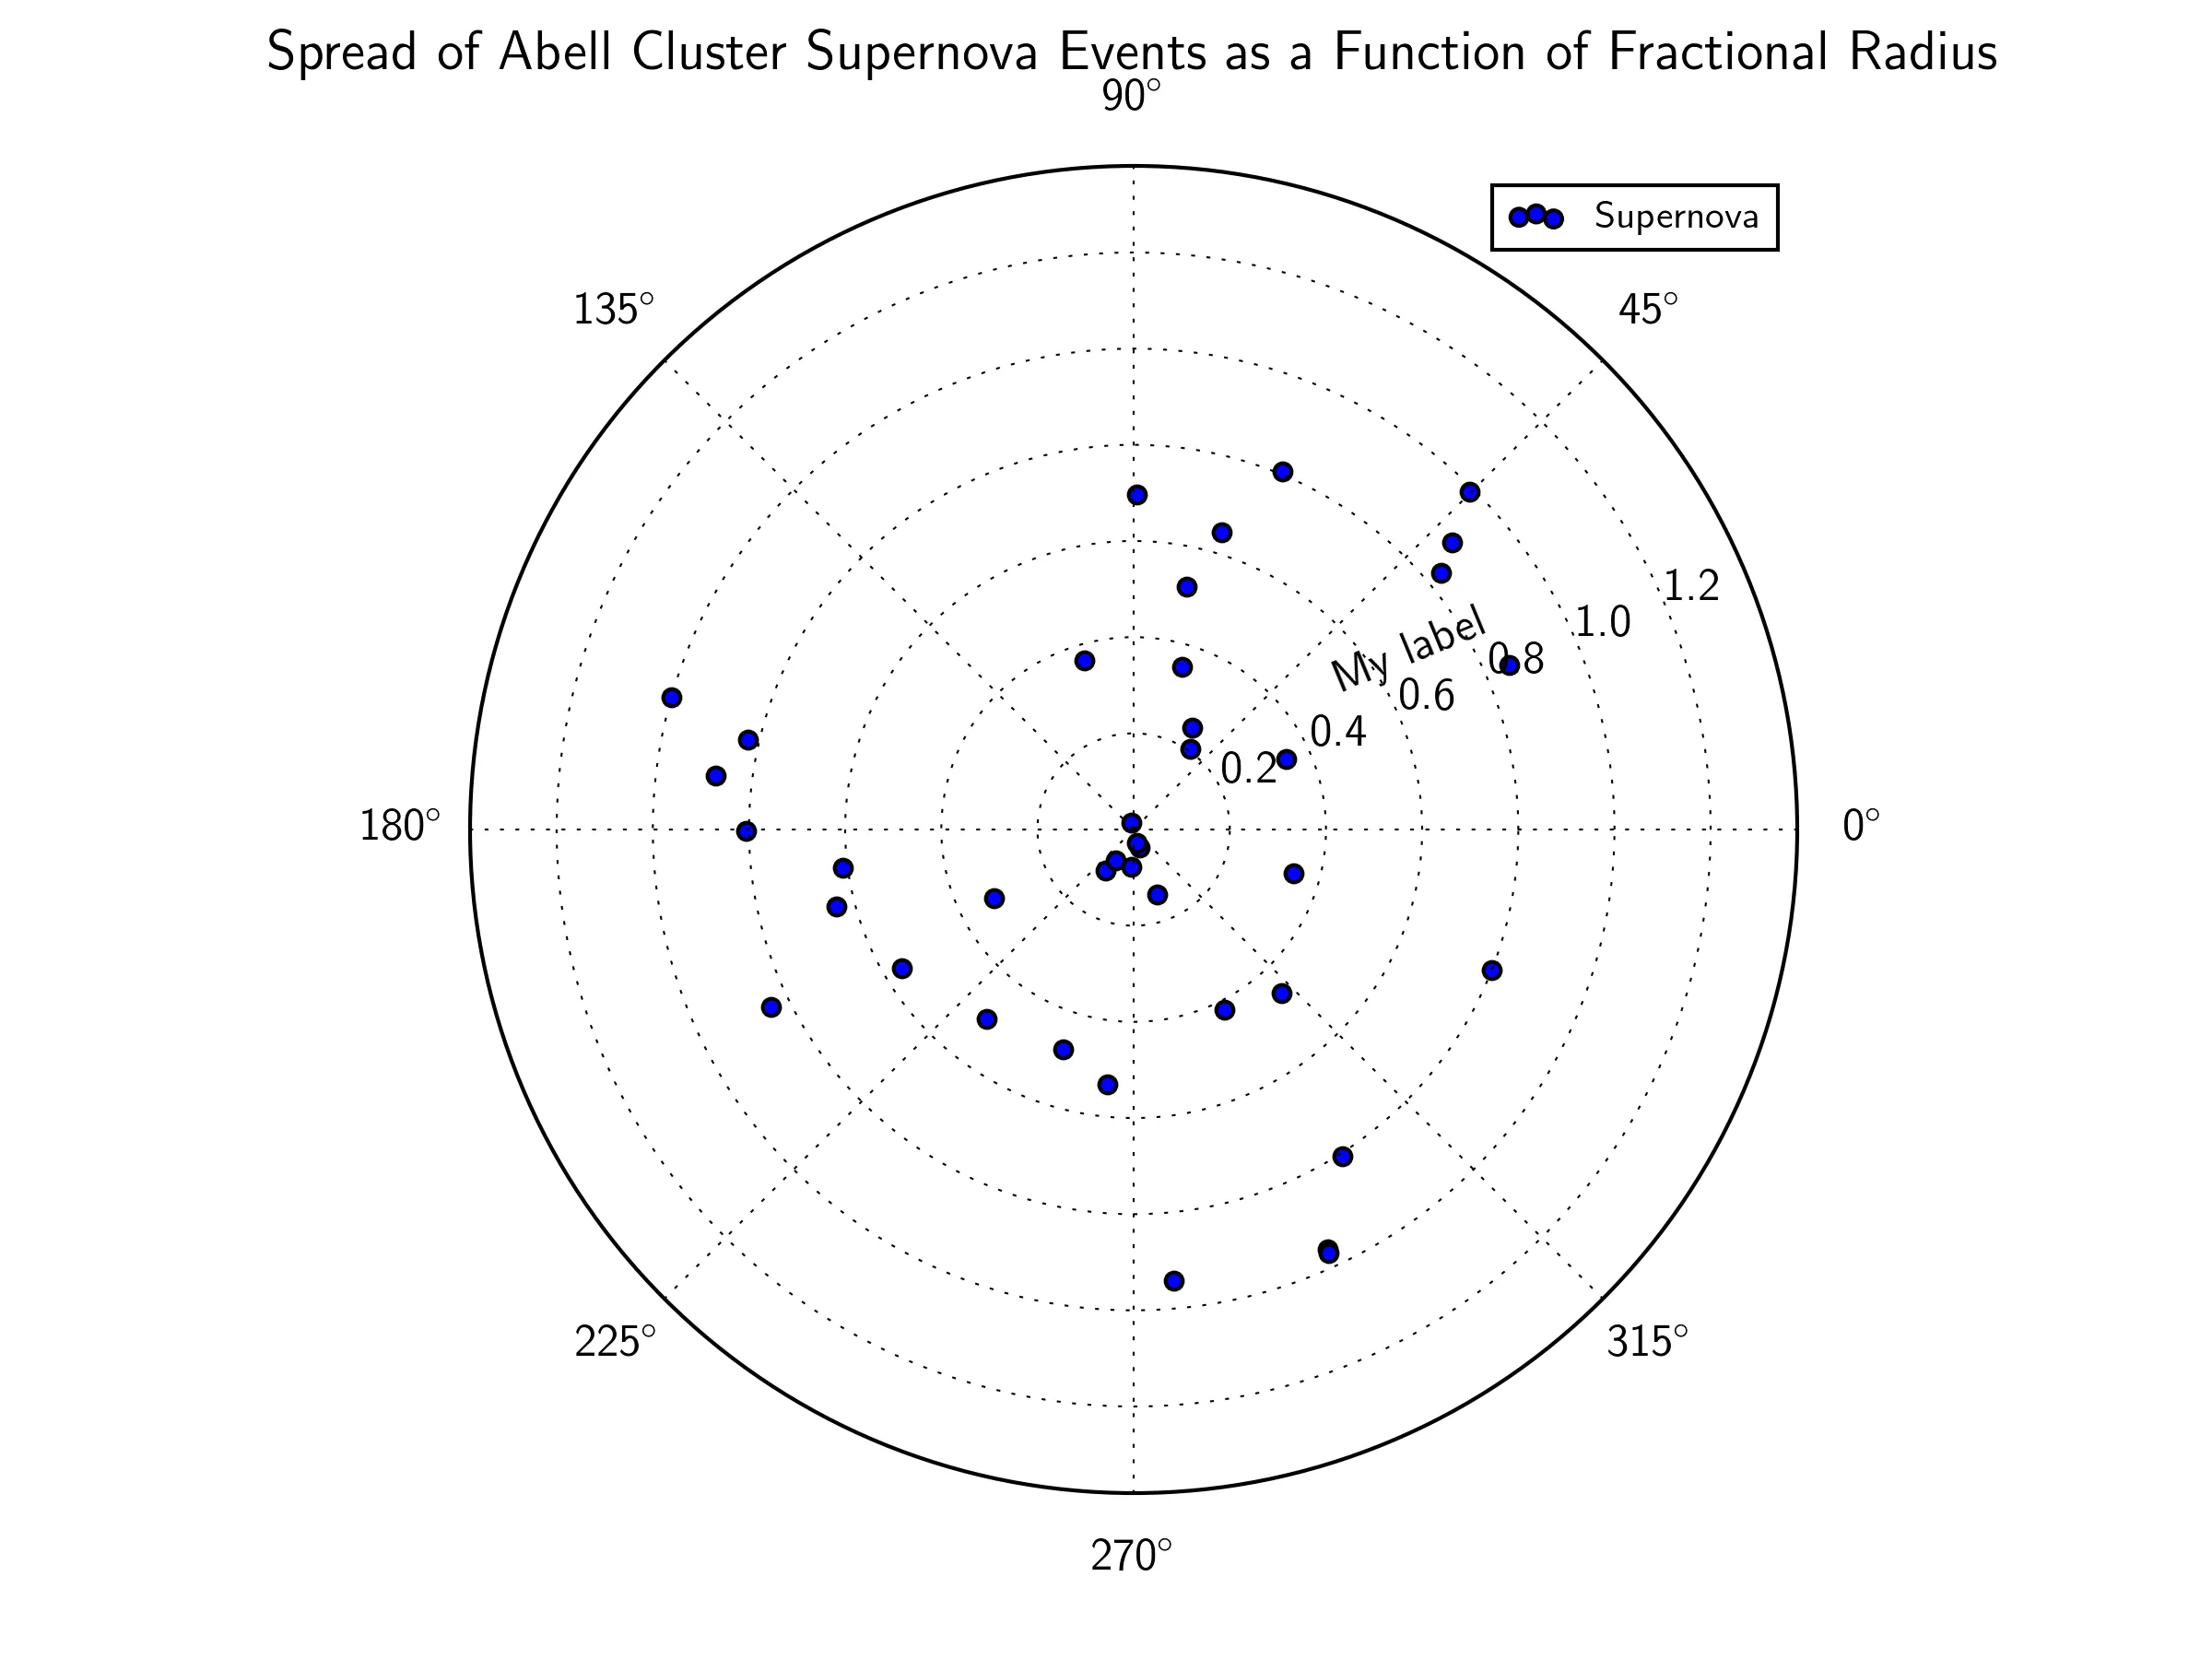
ax.set_title("Spread of Abell Cluster Supernova Events as a Function of Fractional Radius", va='bottom')
ax.legend(['Supernova'])
plt.show()
我的图表看起来像这样。我似乎找不到直接的方法来做到这一点。有人以前处理过这个问题并有任何建议吗?