我正在尝试在matplotlib柱状图的y轴数值后添加mi或km(英里、千米)。
目前,我只是向matplotlib提供值,它会自动制作y轴标签。我无法弄清如何在值的末尾添加mi。
例如:24 > 24 mi
有一个ax.set_7ticklabels()选项,但这样我需要静态设置它们。
我正在尝试在matplotlib柱状图的y轴数值后添加mi或km(英里、千米)。
目前,我只是向matplotlib提供值,它会自动制作y轴标签。我无法弄清如何在值的末尾添加mi。
例如:24 > 24 mi
有一个ax.set_7ticklabels()选项,但这样我需要静态设置它们。
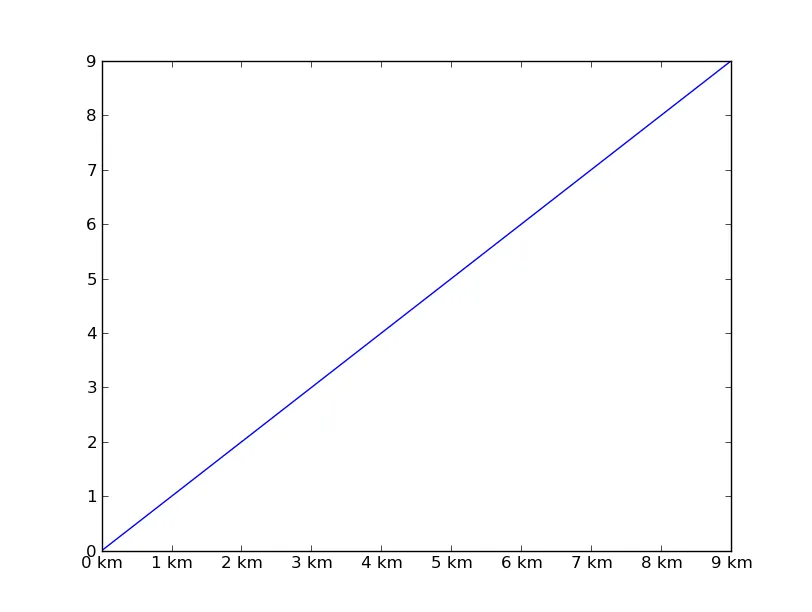
你想要的是类似这样的东西吗?
import matplotlib.pyplot as plt
from matplotlib.ticker import FormatStrFormatter

x = range(10)
plt.plot(x)

plt.gca().xaxis.set_major_formatter(FormatStrFormatter('%d km'))

plt.show()