Matplotlib/pyplot: 自动调整y轴单位

7

我希望修改下面图表的Y轴单位。最好使用像M(百万)、k(千)这样的单位来表示大数值。例如,Y轴应该显示为:50k,100k,150k等。

下面的图表由以下代码片段生成:

plt.autoscale(enable=True, axis='both')
plt.title("TTL Distribution")
plt.xlabel('TTL Value')
plt.ylabel('Number of Packets')
y = graphy  # data from a sqlite query
x = graphx  # data from a sqlite query
width = 0.5
plt.bar(x, y, width, align='center', linewidth=2, color='red', edgecolor='red')
fig = plt.gcf()
plt.show()

我看到了这篇帖子,认为我可以编写自己的格式化函数:

def y_fmt(x, y):
    if max_y > 1000000:
        val = int(y)/1000000
        return '{:d} M'.format(val)
    elif max_y > 1000:
        val = int(y) / 1000
        return '{:d} k'.format(val)
    else:
        return y

但是我错过了使用的柱状图没有可用于plt.yaxis.set_major_formatter(tick.FuncFormatter(y_fmt))函数。

我如何获得更好的Y轴格式?

[TTL分布图]

2个回答

15

原则上,您始终可以通过plt.gca().yaxis.set_xticklabels()设置自定义标签。

但是,我不确定为什么不能在这里使用matplotlib.ticker.FuncFormatterFuncFormatter的设计目的正是为了根据刻度标签的位置和值提供自定义刻度标签。实际上,在matplotlib示例集合中有一个不错的示例

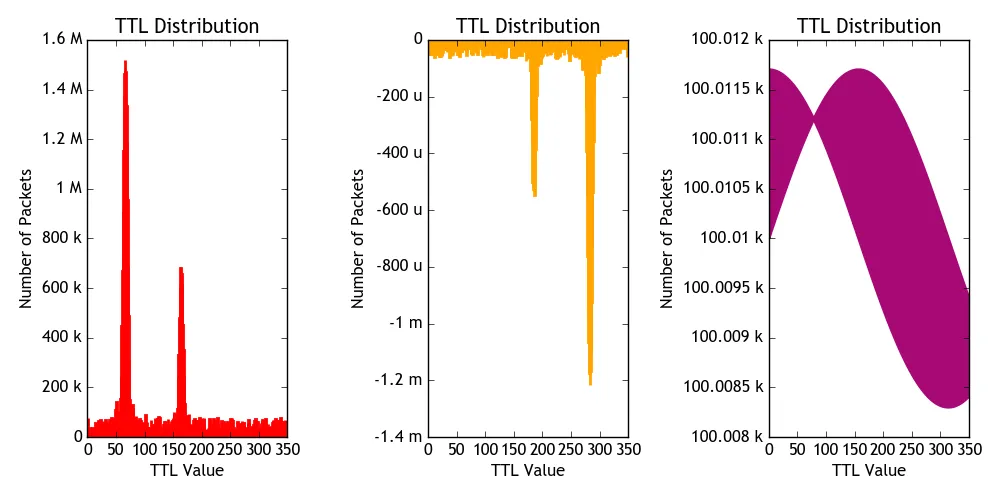
在这种情况下,我们可以像期望的那样使用FuncFormatter,在matplotlib图形的轴上提供单位前缀作为后缀。为此,我们迭代1000的倍数,并检查要格式化的值是否超过它。如果该值是整数,则我们可以将其格式化为带有相应单位符号的整数。另一方面,如果小数点后面有余数,则我们检查需要格式化此数字的小数位数。

以下是完整示例:

import numpy as np
import matplotlib.pyplot as plt
from matplotlib.ticker import FuncFormatter

def y_fmt(y, pos):
    decades = [1e9, 1e6, 1e3, 1e0, 1e-3, 1e-6, 1e-9 ]
    suffix  = ["G", "M", "k", "" , "m" , "u", "n"  ]
    if y == 0:
        return str(0)
    for i, d in enumerate(decades):
        if np.abs(y) >=d:
            val = y/float(d)
            signf = len(str(val).split(".")[1])
            if signf == 0:
                return '{val:d} {suffix}'.format(val=int(val), suffix=suffix[i])
            else:
                if signf == 1:
                    print val, signf
                    if str(val).split(".")[1] == "0":
                       return '{val:d} {suffix}'.format(val=int(round(val)), suffix=suffix[i]) 
                tx = "{"+"val:.{signf}f".format(signf = signf) +"} {suffix}"
                return tx.format(val=val, suffix=suffix[i])

                #return y
    return y


fig, ax = plt.subplots(ncols=3, figsize=(10,5))

x = np.linspace(0,349,num=350) 
y = np.sinc((x-66.)/10.3)**2*1.5e6+np.sinc((x-164.)/8.7)**2*660000.+np.random.rand(len(x))*76000.  
width = 1

ax[0].bar(x, y, width, align='center', linewidth=2, color='red', edgecolor='red')
ax[0].yaxis.set_major_formatter(FuncFormatter(y_fmt))

ax[1].bar(x[::-1], y*(-0.8e-9), width, align='center', linewidth=2, color='orange', edgecolor='orange')
ax[1].yaxis.set_major_formatter(FuncFormatter(y_fmt))

ax[2].fill_between(x, np.sin(x/100.)*1.7+100010, np.cos(x/100.)*1.7+100010, linewidth=2, color='#a80975', edgecolor='#a80975')
ax[2].yaxis.set_major_formatter(FuncFormatter(y_fmt))

for axes in ax:
    axes.set_title("TTL Distribution")
    axes.set_xlabel('TTL Value')
    axes.set_ylabel('Number of Packets')
    axes.set_xlim([x[0], x[-1]+1])

plt.show()

提供以下情节:

这里输入图片描述


不错的例子,比我的完整得多。但是你写道:“如果小数点后面有余数,我们会检查需要多少位小数”,但是截断仍然有点随意?例如,y_fmt(100100, 0) 返回 100.1 k,但 y_fmt(100010, 0) 返回 100 k - Bart
1
@Bart 正确!我确实想到了那个问题,但之后就忘记了。我更新了示例以包括这种情况,其中数字很大但彼此接近。 - ImportanceOfBeingErnest
1
还有内置的 EngFormatter,可以直接执行非常相似的操作。http://matplotlib.org/examples/api/engineering_formatter.html - tacaswell
@tacaswell 非常好!这是在哪个版本中引入的?正常的API文档没有它(还没有?)。 - ImportanceOfBeingErnest

5
你已经非常接近了;有一件(可能)令人困惑的事情是,FuncFormatter 的第一个参数是刻度值,第二个参数是刻度位置,当命名为 x,y 时,可能会对 y 轴造成困惑。为了清晰起见,在下面的示例中将它们重命名。

该函数应该输入两个参数(刻度值 x 和位置 pos),并返回一个字符串。

(http://matplotlib.org/api/ticker_api.html#matplotlib.ticker.FuncFormatter)

工作示例:

import numpy as np
import matplotlib.pylab as pl
import matplotlib.ticker as tick

def y_fmt(tick_val, pos):
    if tick_val > 1000000:
        val = int(tick_val)/1000000
        return '{:d} M'.format(val)
    elif tick_val > 1000:
        val = int(tick_val) / 1000
        return '{:d} k'.format(val)
    else:
        return tick_val

x = np.arange(300)
y = np.random.randint(0,2000000,x.size)

width = 0.5
pl.bar(x, y, width, align='center', linewidth=2, color='red', edgecolor='red')
pl.xlim(0,300)

ax = pl.gca()
ax.yaxis.set_major_formatter(tick.FuncFormatter(y_fmt))

enter image description here


1
感谢您的回答!然而,ImportanceOfBeingErnest的答案还进一步扩展了后缀,因此我将其标记为“已接受”。 - Patrick

网页内容由stack overflow 提供, 点击上面的
可以查看英文原文,
原文链接