Matplotlib pyplot轴格式化程序

14

我有一张图片:

在这里输入图片描述

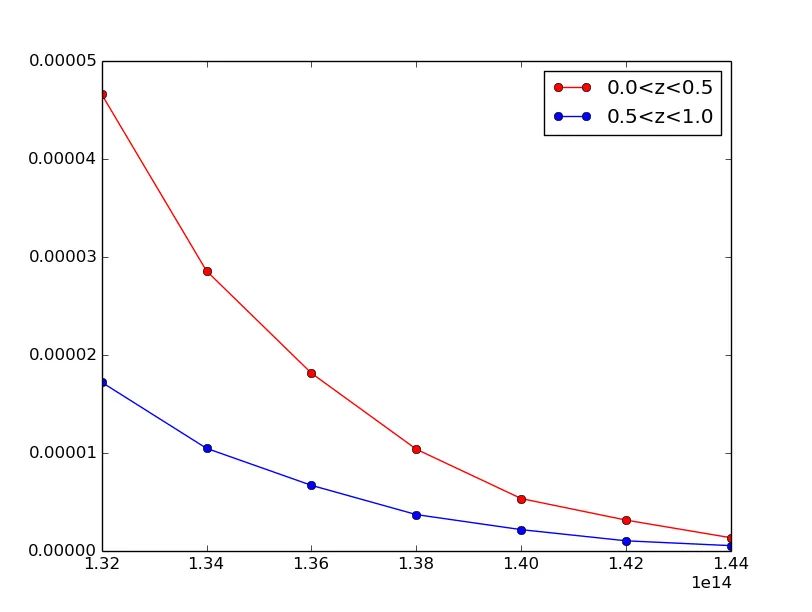
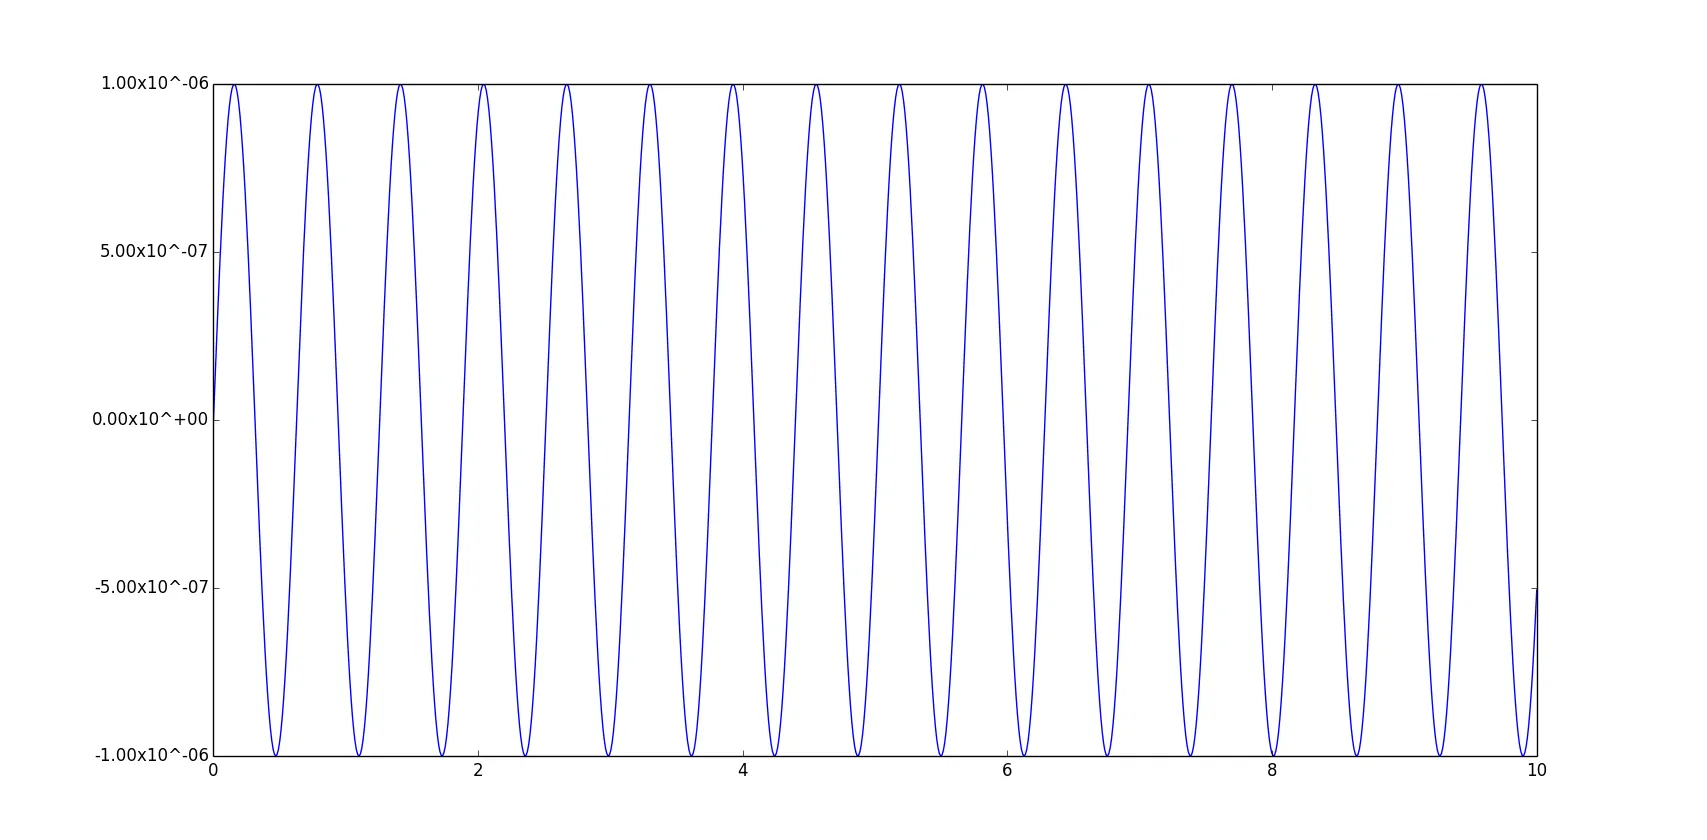
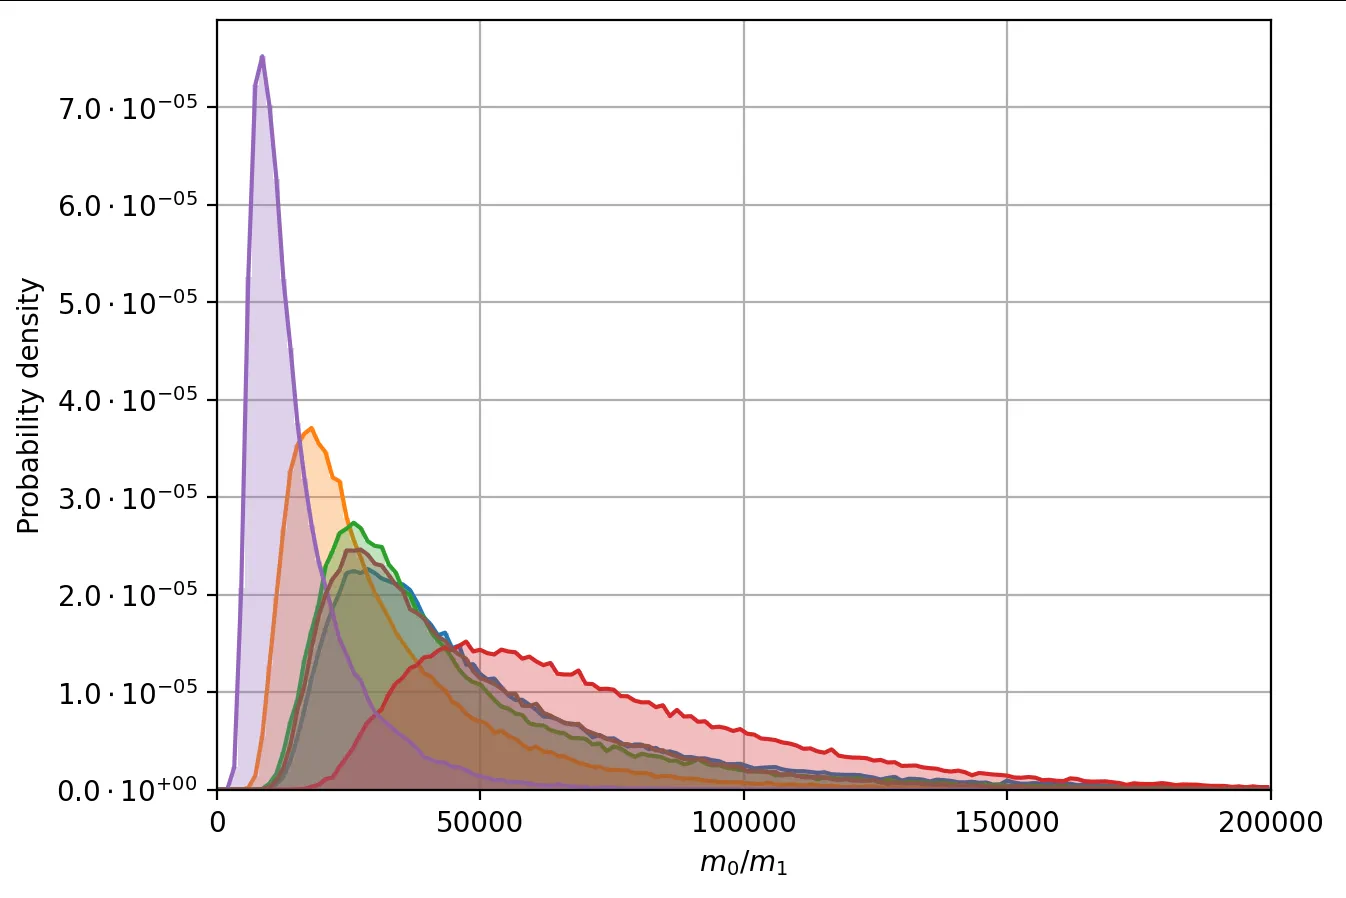
我希望在y轴上显示5x10^-5 4x10^-5等形式,而不是0.00005 0.00004

目前我尝试过的方法是:

fig = plt.figure()
ax = fig.add_subplot(111)
y_formatter = matplotlib.ticker.ScalarFormatter(useOffset=True)
ax.yaxis.set_major_formatter(y_formatter)

ax.plot(m_plot,densities1,'-ro',label='0.0<z<0.5')
ax.plot(m_plot,densities2, '-bo',label='0.5<z<1.0')


ax.legend(loc='best',scatterpoints=1)
plt.legend()
plt.show() 

这似乎不起作用。 刻度线文档页面似乎没有直接答案。

2个回答

22
您可以使用matplotlib.ticker.FuncFormatter来选择刻度标记的格式,此函数将输入(一个浮点数)转换为指数符号,并用"x10^"替换掉'e',以获得所需的格式。以下是示例代码:
import matplotlib.pyplot as plt
import matplotlib.ticker as tick
import numpy as np

x = np.linspace(0, 10, 1000)
y = 0.000001*np.sin(10*x)

fig = plt.figure()
ax = fig.add_subplot(111)

ax.plot(x, y)

def y_fmt(x, y):
    return '{:2.2e}'.format(x).replace('e', 'x10^')

ax.yaxis.set_major_formatter(tick.FuncFormatter(y_fmt))

plt.show()

image

如果您愿意使用指数表示法(即5.0e-6.0),那么有一种更简洁的解决方案,您可以使用matplotlib.ticker.FormatStrFormatter选择一个格式字符串,如下所示。格式字符串由标准Python字符串格式化规则给出。

...

y_fmt = tick.FormatStrFormatter('%2.2e')
ax.yaxis.set_major_formatter(y_fmt)

...

2
你的简短解决方案中的 %2.2e 是什么意思? - user3397243
4
%2.2e用来选择字符串的格式。其中数字部分表示你想要保留的小数位数,字母'e'表示科学计数法。详细信息可以在这里找到。 - Ffisegydd
函数 y_fmt(x,y) 有两个参数,但我没有看到在函数中使用 y。我以前见过这种行为,它叫什么?我应该如何理解它? - JMJ
x是数值,y是刻度的索引。通常情况下不需要使用“y”。当然,“y”可以用于基于刻度位置的格式化。 - nvd
2
如果我有1000、2000...10000,你知道如何将它们显示为1K、2K、10K吗? - weefwefwqg3
显示剩余2条评论

2

关于更好的字符串格式化解决方案,只需进行简单修改:我建议将格式函数更改为包括LaTeX格式:

def y_fmt(x, y):
    return '${:2.1e}'.format(x).replace('e', '\\cdot 10^{') + '}$'

enter image description here


网页内容由stack overflow 提供, 点击上面的
可以查看英文原文,
原文链接