我试图调整x轴的日期刻度标签格式,使其仅显示年份和月份值。根据我在网上找到的信息,我需要使用
mdates.DateFormatter,但是它在我的当前代码中没有任何效果。有人看到问题出在哪里吗?(日期是pandas数据框的索引)import matplotlib.dates as mdates
import matplotlib.pyplot as plt
import pandas as pd
fig = plt.figure(figsize = (10,6))
ax = fig.add_subplot(111)
ax.xaxis.set_major_formatter(mdates.DateFormatter('%Y-%m'))
basicDF['some_column'].plot(ax=ax, kind='bar', rot=75)
ax.xaxis_date()
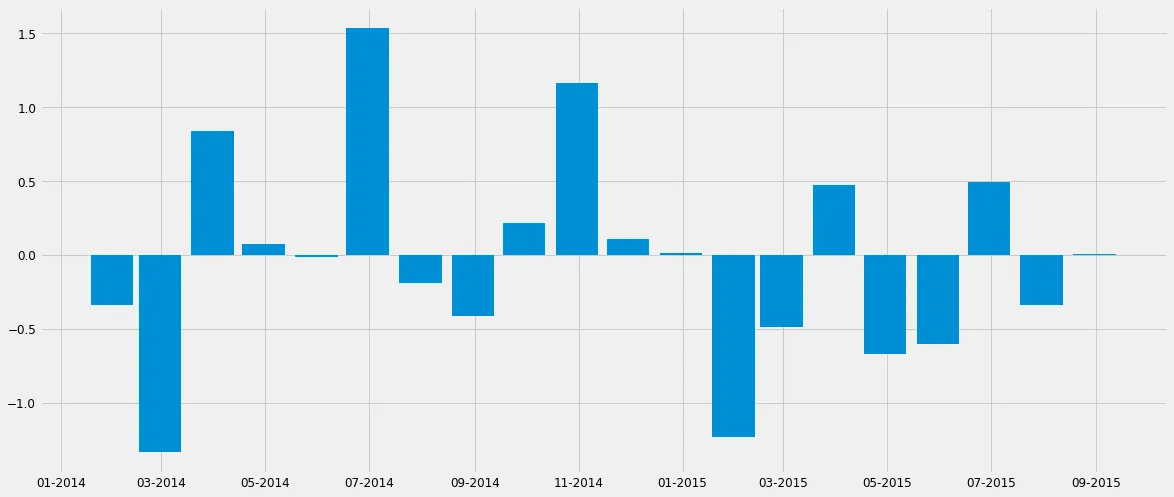
重现场景代码:
import numpy as np
import matplotlib.dates as mdates
import matplotlib.pyplot as plt
import pandas as pd
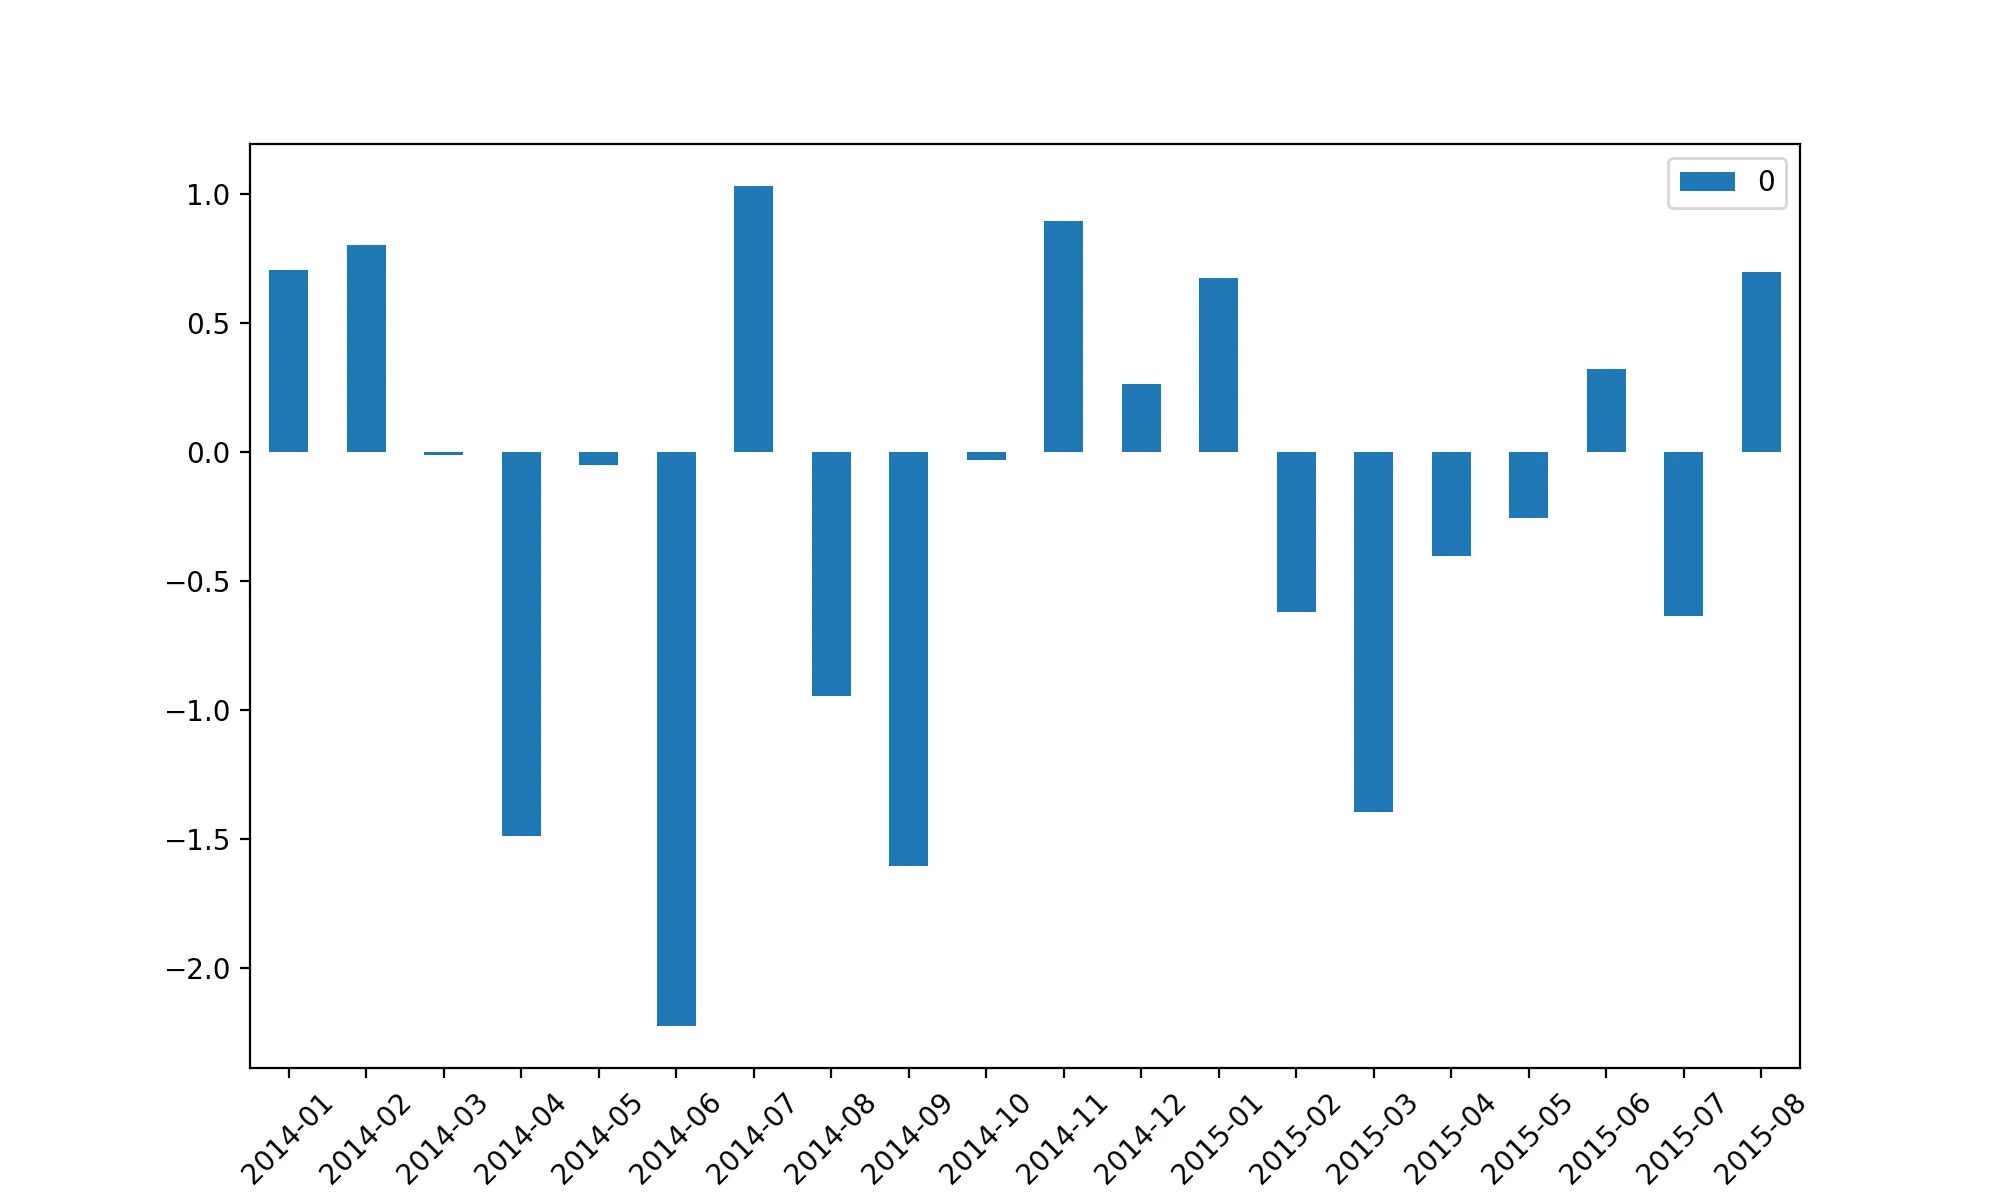
rng = pd.date_range('1/1/2014', periods=20, freq='m')
blah = pd.DataFrame(data = np.random.randn(len(rng)), index=rng)
fig = plt.figure(figsize = (10,6))
ax = fig.add_subplot(111)
ax.xaxis.set_major_formatter(mdates.DateFormatter('%Y-%m'))
blah.plot(ax=ax, kind='bar')
ax.xaxis_date()
仍然无法只显示年份和月份。
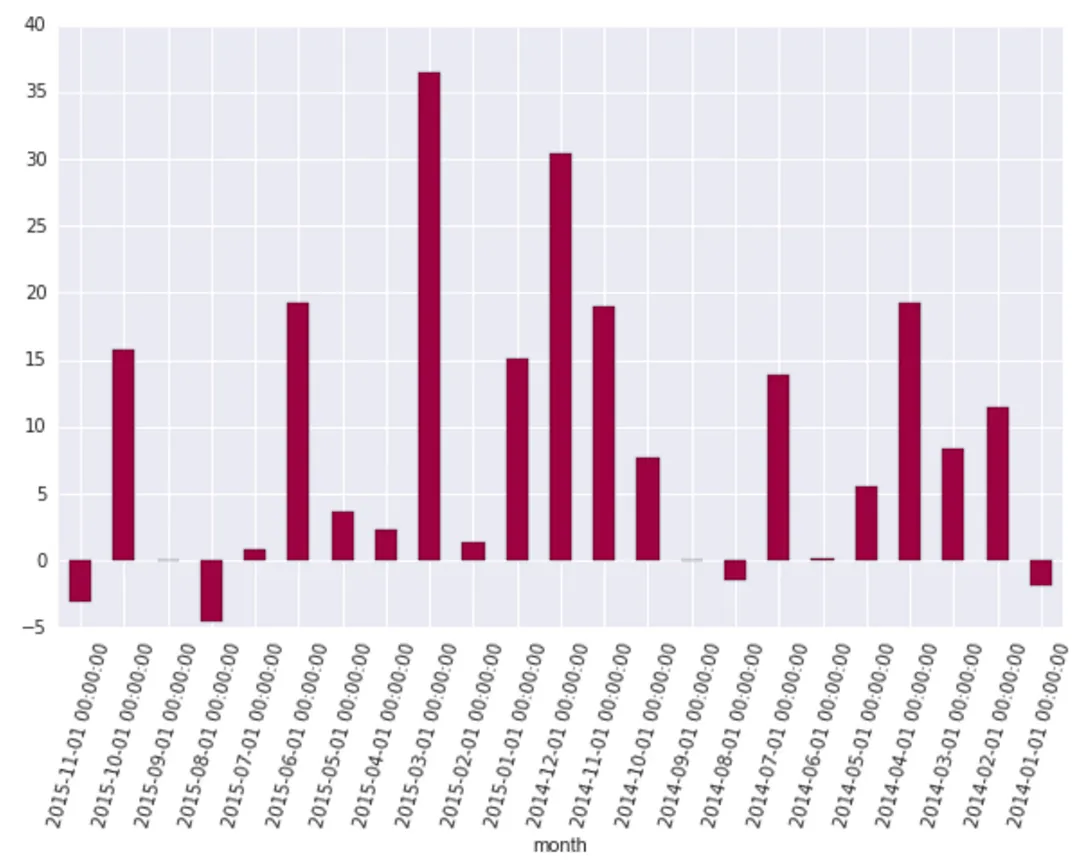
如果我在.plot之后设置格式,会出现以下错误:
ValueError:DateFormatter发现了一个x=0的值,这是一个非法日期。这通常是因为您尚未告知轴正在绘制日期,例如,使用
x.xaxis_date()。
如果我在ax.xaxis_date()之前或之后放置它,情况也是一样的。
 ”,其中保留了HTML标记和图片链接。