Matplotlib:在3D条形图的x轴上格式化日期

14

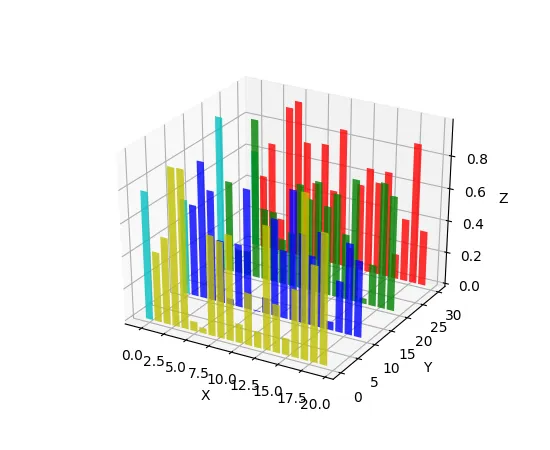
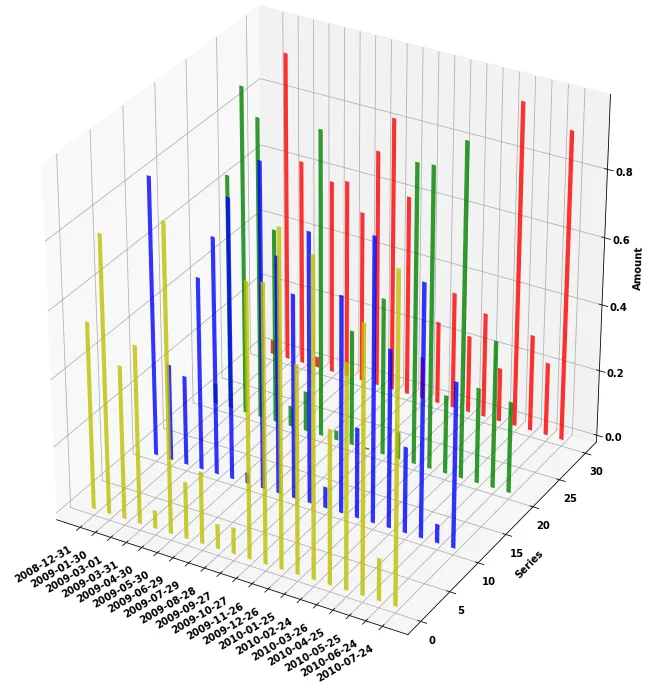
如果有这个3D条形图的示例代码,你该如何将x轴上的数字数据转换为格式化的日期/时间字符串?我尝试使用ax.xaxis_date()函数但没有成功。我还尝试使用plot_date()函数,但它似乎不适用于3D条形图。下面是一个修改过的示例代码,用于说明我的尝试:

from mpl_toolkits.mplot3d import Axes3D
import matplotlib.pyplot as plt
import numpy as np
import matplotlib.dates as dates

dates = [dates.date2num(datetime.datetime(2009,3,12)),
         dates.date2num(datetime.datetime(2009,6,9)),
         dates.date2num(datetime.datetime(2010,1,1)),
         #etc...
         ]

fig = plt.figure()
ax = Axes3D(fig)
for c, z in zip(['r', 'g', 'b', 'y'], [30, 20, 10, 0]):
    xs = np.array(dates)
    ys = np.random.rand(20)
    ax.bar(xs, ys, zs=z, zdir='y', color=c, alpha=0.8)

ax.set_xlabel('Date & Time')
ax.set_ylabel('Series')
ax.set_zlabel('Amount')

plt.show()

alt text


我刚试了一下你的代码,在我的设备上绘图效果相当不错(x值与日期匹配)。我使用的是Python 2.6.4和最新的matplotlib(版本0.99.1)。你需要更新一下你的Python包吗? - Justin Peel
你只是想让xticks变成字符串而不是数字吗? - Mark
是的,或者可以传递一个函数名来动态格式化刻度,而不是预先生成所有字符串的选项。 - pokstad
请查看我的回答更新,我修改了使用FuncFormatter函数格式化标签。我还进行了美化,并使用set_major_locator使所有日期显示在x轴上。 - Mark
1个回答

16

可能会有些混淆,在Axes3D中,轴的属性是w_xaxis、w_yaxis和w_zaxis,而不是通常的x轴、y轴等。

python 3.8.11matplotlib 3.4.3中进行过测试。

from mpl_toolkits.mplot3d import Axes3D
import matplotlib.pyplot as plt
import numpy as np
import matplotlib.dates as dates
import datetime, random
import matplotlib.ticker as ticker

def random_date():
    date = datetime.date(2008, 12, 1)
    while 1:
        date += datetime.timedelta(days=30)
        yield (date)

def format_date(x, pos=None):
    return dates.num2date(x).strftime('%Y-%m-%d') #use FuncFormatter to format dates

r_d = random_date()
some_dates = [dates.date2num(next(r_d)) for i in range(0,20)]

fig = plt.figure(figsize=(10, 10))
ax = fig.add_subplot(projection='3d')

for c, z in zip(['r', 'g', 'b', 'y'], [30, 20, 10, 0]):
    xs = np.array(some_dates)
    ys = np.random.rand(20)
    ax.bar(xs, ys, zs=z, zdir='y', color=c, alpha=0.8,width=8)

ax.w_xaxis.set_major_locator(ticker.FixedLocator(some_dates)) # I want all the dates on my xaxis
ax.w_xaxis.set_major_formatter(ticker.FuncFormatter(format_date))
for tl in ax.w_xaxis.get_ticklabels(): # re-create what autofmt_xdate but with w_xaxis
    tl.set_ha('right')
    tl.set_rotation(30)     

ax.set_ylabel('Series')
ax.set_zlabel('Amount')

plt.show()

生成:

enter image description here


网页内容由stack overflow 提供, 点击上面的
可以查看英文原文,
原文链接