Python Matplotlib pyplot 直方图

3

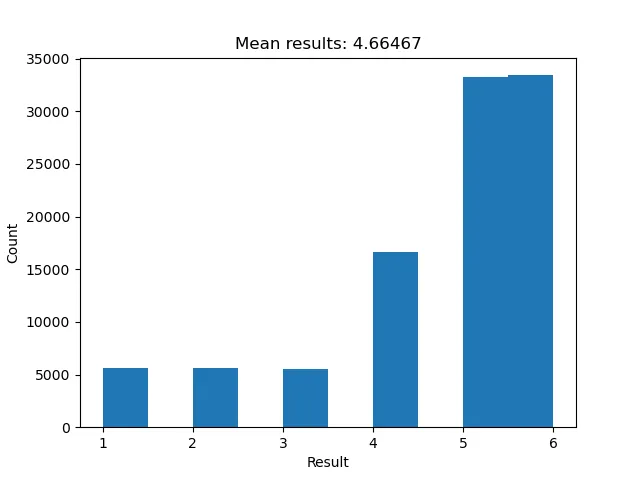
我正在绘制一个相当简单的模拟的直方图。在直方图上,最后两列被合并在一起,看起来很奇怪。请查看以下代码和绘图结果。

谢谢!

   import numpy as np
   import random
   import matplotlib.pyplot as plt

   die = [1, 2, 3, 4, 5, 6]
   N = 100000
   results = []
   # first round
   for i in range(N):
       X1 = random.choice(die)
       if X1 > 4:
           results.append(X1)
       else:
           X2 = random.choice(die)
           if X2 > 3:
               results.append(X2)
           else:
               X3 = random.choice(die)
               results.append(X3)

   plt.hist(results)
   plt.ylabel('Count')
   plt.xlabel('Result');
   plt.title("Mean results: " + str(np.mean(results)))
   plt.show()

输出结果如下图所示。我不明白为什么最后两列粘在一起了。 直方图
感谢任何帮助!
3个回答

1
默认情况下,matplotlib将输入范围分为10个大小相等的箱子。所有箱子跨越半开区间[x1,x2),但最右边的箱子包括范围的结尾。您的范围是[1,6],因此您的箱子是[1,1.5)[1.5,2),...,[5.5,6],所以所有整数都在第一个、第三个等奇数序号的箱子中,但六在第十个(偶数)箱子中。
要修复布局,请指定箱子:
# This will give you a slightly different layout with only 6 bars
plt.hist(results, bins=die + [7])
# This will simulate your original plot more closely, with empty bins in between
plt.hist(results, bins=np.arange(2, 14)/2)

最后一部分生成数字序列2,3,...,13,然后将每个数字除以2,得到1, 1.5, ..., 6.5,因此最后一个箱子跨越[6,6.5]

非常感谢!你提供的第二行代码给我带来了期望的结果! - SmurfAcco

1
你需要告诉Matplotlib你想让直方图与bins匹配。否则,Matplotlib会为您选择默认值10 - 在这种情况下,它无法很好地取整。
# ... your code ...

plt.hist(results, bins=die)  # or bins = 6
plt.ylabel('Count')
plt.xlabel('Result');
plt.title("Mean results: " + str(np.mean(results)))
plt.show()

完整的文档在这里:https://matplotlib.org/3.2.2/api/_as_gen/matplotlib.pyplot.hist.html

0

它不行,但你可以尝试。

import seaborn as sns
sns.distplot(results , kde = False)

网页内容由stack overflow 提供, 点击上面的
可以查看英文原文,
原文链接