我有一个角度的列表,想要显示一个极坐标直方图,其中[0°, 360°)值范围被分成相等的箱子,并显示角度列表中有多少个值落入每个箱子。我使用以下代码获取直方图数据(我已经检查了它是正确的):
bins_number = 8 # the [0, 360) interval will be subdivided into this number of equal bins
bins = np.linspace(0.0, 360.0, bins_number + 1)
n, _, _ = plt.hist(angles, bins)
现在,我已经尝试使用以下代码将这些数据绘制成极坐标直方图:
plt.clf()
width = 2 * np.pi / bins_number
ax = plt.subplot(1, 1, 1, projection='polar')
bars = ax.bar(bins[:bins_number], n, width=width, bottom=0.0)
for bar in bars:
    bar.set_alpha(0.5)
plt.show()
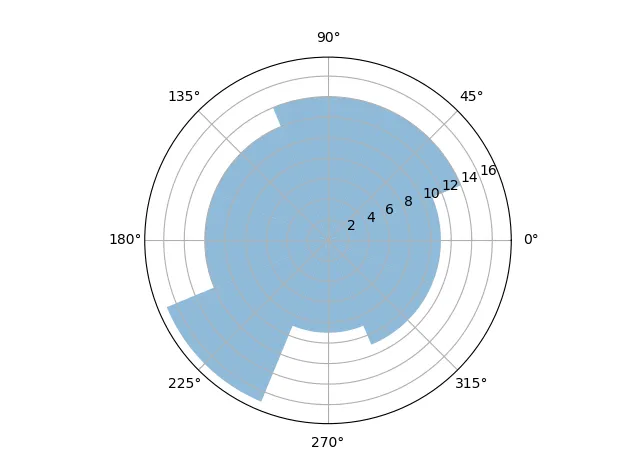
但我得到的结果如下图所示:
正如您所看到的,条形图的角度不正确,有些条形图彼此重叠,而它们应该是相邻的且不重叠的。
我做错了什么?提前感谢您的帮助。