当Joe Kington建议仅绘制必要数据时,他提出了最明智的答案,但在某些情况下,最好绘制所有数据并缩放到特定部分。此外,拥有一个“autoscale_y”函数将非常方便,它仅需要轴对象(即不像这里的答案那样直接使用数据)。
这是一个函数,它基于可见x区域中的数据重新调整y轴:
def autoscale_y(ax,margin=0.1):
"""This function rescales the y-axis based on the data that is visible given the current xlim of the axis.
ax -- a matplotlib axes object
margin -- the fraction of the total height of the y-data to pad the upper and lower ylims"""
import numpy as np
def get_bottom_top(line):
xd = line.get_xdata()
yd = line.get_ydata()
lo,hi = ax.get_xlim()
y_displayed = yd[((xd>lo) & (xd<hi))]
h = np.max(y_displayed) - np.min(y_displayed)
bot = np.min(y_displayed)-margin*h
top = np.max(y_displayed)+margin*h
return bot,top
lines = ax.get_lines()
bot,top = np.inf, -np.inf
for line in lines:
new_bot, new_top = get_bottom_top(line)
if new_bot < bot: bot = new_bot
if new_top > top: top = new_top
ax.set_ylim(bot,top)
import numpy as np
import matplotlib.pyplot as plt
x = np.linspace(-100,100,1000)
y = x**2 + np.cos(x)*100
fig,axs = plt.subplots(1,2,figsize=(8,5))
for ax in axs:
ax.plot(x,y)
ax.plot(x,y*2)
ax.plot(x,y*10)
ax.set_xlim(-10,10)
autoscale_y(axs[1])
axs[0].set_title('Rescaled x-axis')
axs[1].set_title('Rescaled x-axis\nand used "autoscale_y"')
plt.show()
我在 @DanHickstein 的回答基础上进行了扩展,涵盖了绘图、散点图以及 axhline/axvline 等情况下对 x 或 y 轴进行缩放的情况。只需简单地调用 autoscale()
即可在最近的坐标轴上工作。如果您希望进行编辑,请在 gist 上进行分支操作:fork it on gist。
def autoscale(ax=None, axis='y', margin=0.1):
'''Autoscales the x or y axis of a given matplotlib ax object
to fit the margins set by manually limits of the other axis,
with margins in fraction of the width of the plot
Defaults to current axes object if not specified.
'''
import matplotlib.pyplot as plt
import numpy as np
if ax is None:
ax = plt.gca()
newlow, newhigh = np.inf, -np.inf
for artist in ax.collections + ax.lines:
x,y = get_xy(artist)
if axis == 'y':
setlim = ax.set_ylim
lim = ax.get_xlim()
fixed, dependent = x, y
else:
setlim = ax.set_xlim
lim = ax.get_ylim()
fixed, dependent = y, x
low, high = calculate_new_limit(fixed, dependent, lim)
newlow = low if low < newlow else newlow
newhigh = high if high > newhigh else newhigh
margin = margin*(newhigh - newlow)
setlim(newlow-margin, newhigh+margin)
def calculate_new_limit(fixed, dependent, limit):
'''Calculates the min/max of the dependent axis given
a fixed axis with limits
'''
if len(fixed) > 2:
mask = (fixed>limit[0]) & (fixed < limit[1])
window = dependent[mask]
low, high = window.min(), window.max()
else:
low = dependent[0]
high = dependent[-1]
if low == 0.0 and high == 1.0:
# This is a axhline in the autoscale direction
low = np.inf
high = -np.inf
return low, high
def get_xy(artist):
'''Gets the xy coordinates of a given artist
'''
if "Collection" in str(artist):
x, y = artist.get_offsets().T
elif "Line" in str(artist):
x, y = artist.get_xdata(), artist.get_ydata()
else:
raise ValueError("This type of object isn't implemented yet")
return x, y
像它的前身一样,它有点靠技巧,但这是必要的,因为集合和线条有不同的方法来返回xy坐标,而axhline / axvline很难处理,因为它只有两个数据点。
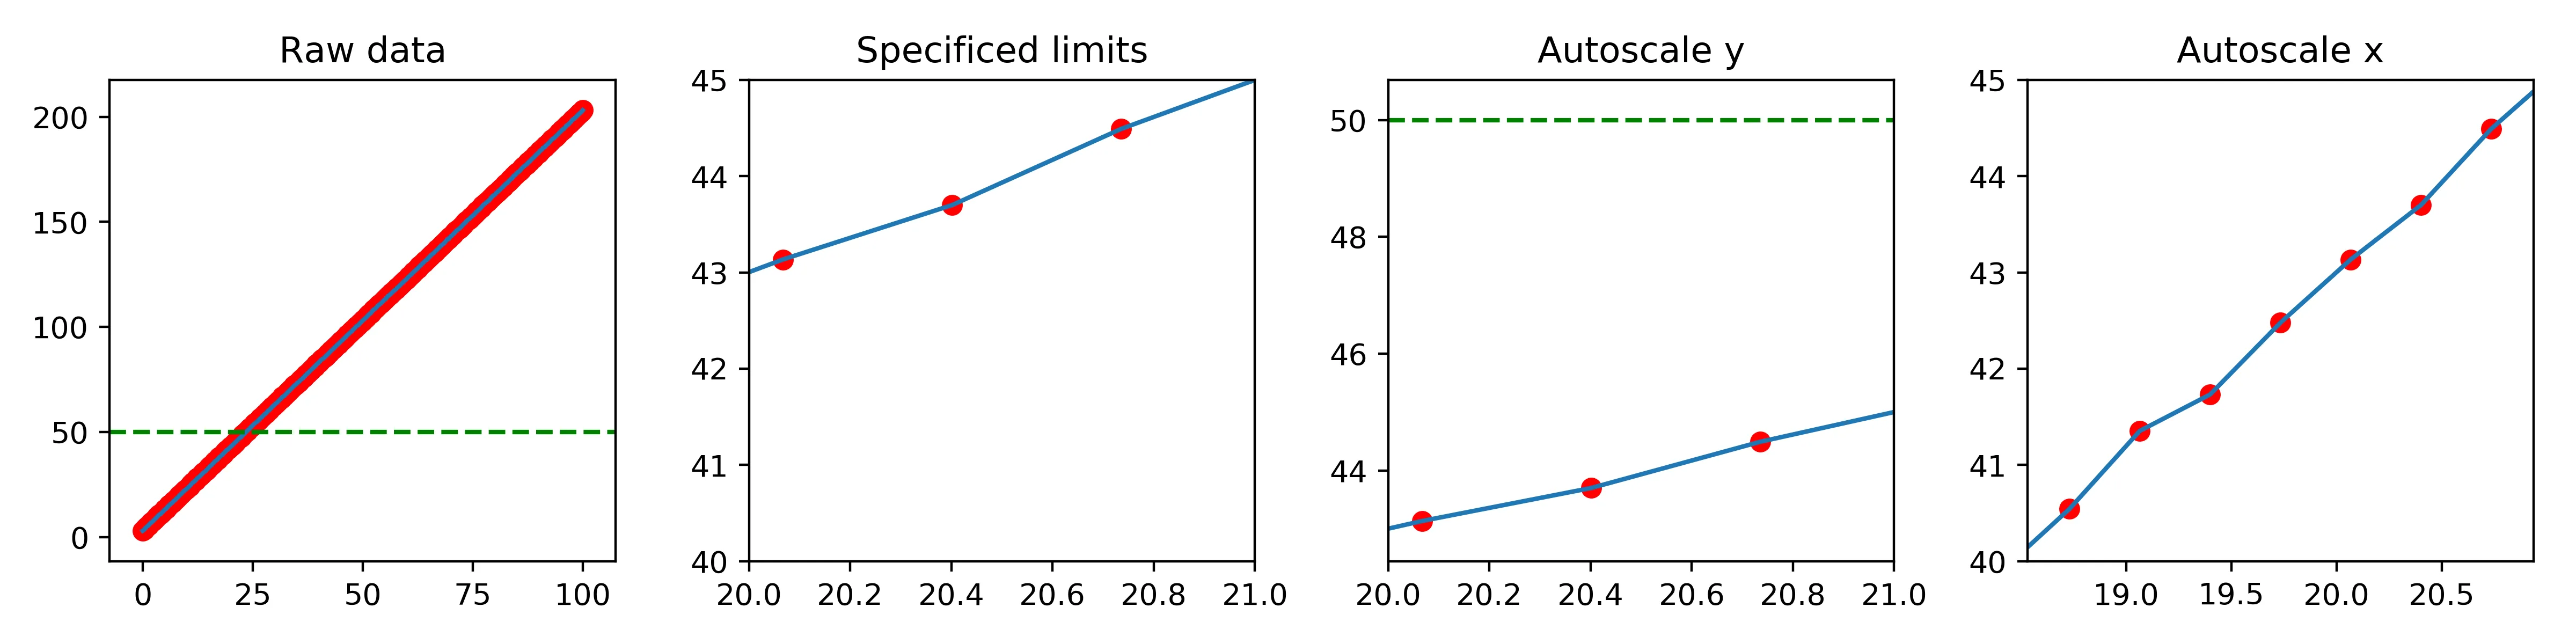
下面是它的实际操作:
fig, axes = plt.subplots(ncols = 4, figsize=(12,3))
(ax1, ax2, ax3, ax4) = axes
x = np.linspace(0,100,300)
noise = np.random.normal(scale=0.1, size=x.shape)
y = 2*x + 3 + noise
for ax in axes:
ax.plot(x, y)
ax.scatter(x,y, color='red')
ax.axhline(50., ls='--', color='green')
for ax in axes[1:]:
ax.set_xlim(20,21)
ax.set_ylim(40,45)
autoscale(ax3, 'y', margin=0.1)
autoscale(ax4, 'x', margin=0.1)
ax1.set_title('Raw data')
ax2.set_title('Specificed limits')
ax3.set_title('Autoscale y')
ax4.set_title('Autoscale x')
plt.tight_layout()
pandas
,它使得使用布尔索引来选择数据非常容易。x
和 y
加载到 DataFrame 中,使用pandas.Series.between(left, right, inclusive=True)
进行布尔选择,并直接使用pandas.DataFrame.plot
进行绘图,它使用了 matplotlib
库。import numpy as np # for the test data
import pandas as pd
# load the data into the dataframe; there are many ways to do this
df = pd.DataFrame({'x': np.arange(0,101,1), 'y': 300-0.1*np.arange(0,101,1)})
# select and plot the data
ax = df[df.x.between(50, 100)].plot(x='x', y='y', kind='scatter', figsize=(5, 4))
我想补充@TomNorway的卓越答案(它节省了我很多时间),以处理某些艺术家部分或完全由NaN组成的情况。
我所做的所有更改都在内部
if len(fixed) > 2:
干杯!
def autoscale(ax=None, axis='y', margin=0.1):
'''Autoscales the x or y axis of a given matplotlib ax object
to fit the margins set by manually limits of the other axis,
with margins in fraction of the width of the plot
Defaults to current axes object if not specified.
'''
if ax is None:
ax = plt.gca()
newlow, newhigh = np.inf, -np.inf
for artist in ax.collections + ax.lines:
x,y = get_xy(artist)
if axis == 'y':
setlim = ax.set_ylim
lim = ax.get_xlim()
fixed, dependent = x, y
else:
setlim = ax.set_xlim
lim = ax.get_ylim()
fixed, dependent = y, x
low, high = calculate_new_limit(fixed, dependent, lim)
newlow = low if low < newlow else newlow
newhigh = high if high > newhigh else newhigh
margin = margin*(newhigh - newlow)
setlim(newlow-margin, newhigh+margin)
def calculate_new_limit(fixed, dependent, limit):
'''Calculates the min/max of the dependent axis given
a fixed axis with limits
'''
if len(fixed) > 2:
mask = (fixed>limit[0]) & (fixed < limit[1]) & (~np.isnan(dependent)) & (~np.isnan(fixed))
window = dependent[mask]
try:
low, high = window.min(), window.max()
except ValueError: # Will throw ValueError if `window` has zero elements
low, high = np.inf, -np.inf
else:
low = dependent[0]
high = dependent[-1]
if low == 0.0 and high == 1.0:
# This is a axhline in the autoscale direction
low = np.inf
high = -np.inf
return low, high
def get_xy(artist):
'''Gets the xy coordinates of a given artist
'''
if "Collection" in str(artist):
x, y = artist.get_offsets().T
elif "Line" in str(artist):
x, y = artist.get_xdata(), artist.get_ydata()
else:
raise ValueError("This type of object isn't implemented yet")
return x, y
y_displayed = yd[((xd>=lo) & (xd<=hi))]
替换为if len(xd)==2 and xd[0]==0.0 and xd[1]==1.0: y_displayed=yd #special case to handle axhline else: y_displayed = yd[((xd>=lo) & (xd<=hi))]
- EL_DONxd = [dt.toordinal() for dt in line.get_xdata()]
。 - bluenote10