我正在尝试修复Python绘制我的数据的方式。请说:
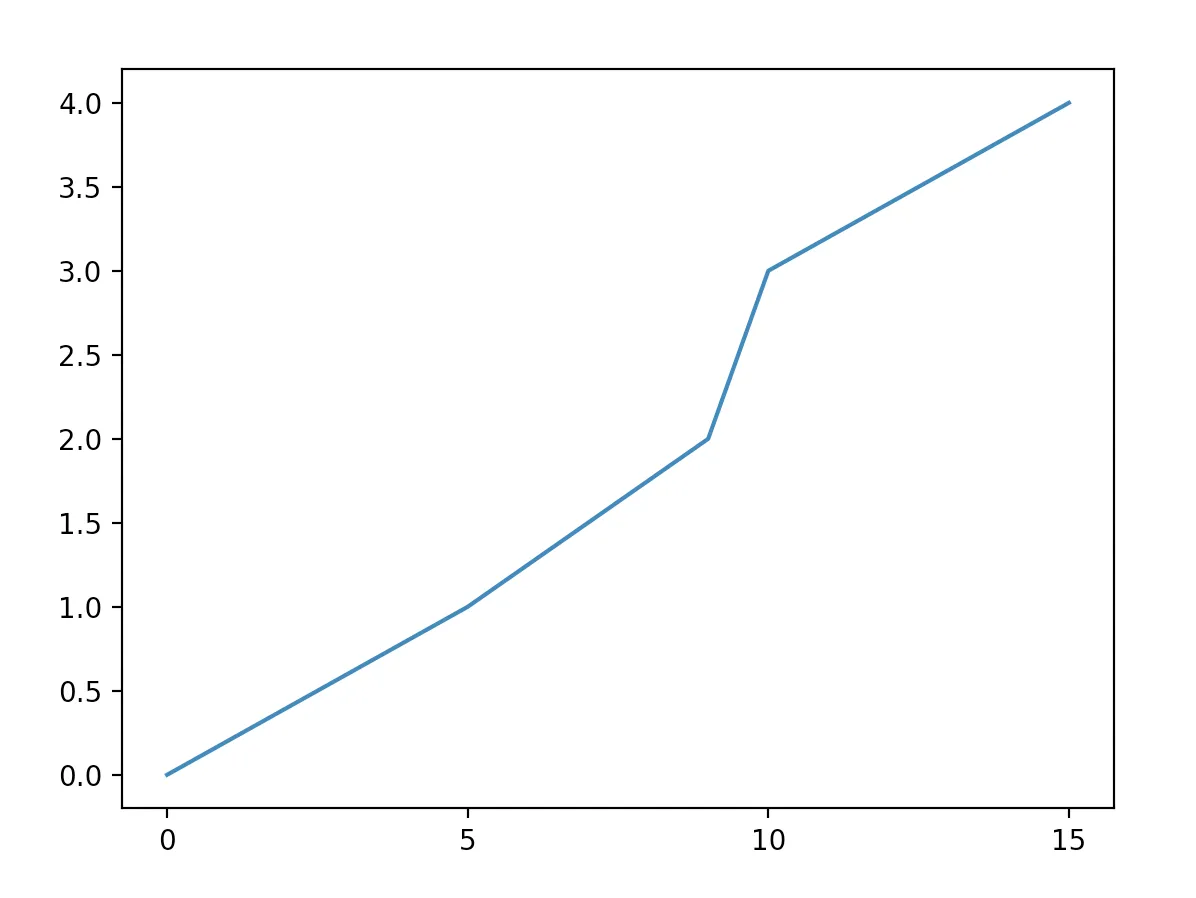
x = [0, 5, 9, 10, 15]
y = [0, 1, 2, 3, 4]

matplotlib.pyplot.plot(x, y)
matplotlib.pyplot.show()
x轴的刻度以5的间隔绘制。有没有办法让它显示1的间隔?
我正在尝试修复Python绘制我的数据的方式。请说:
x = [0, 5, 9, 10, 15]
y = [0, 1, 2, 3, 4]
matplotlib.pyplot.plot(x, y)
matplotlib.pyplot.show()
您可以使用 plt.xticks 来明确设置刻度的位置:
plt.xticks(np.arange(min(x), max(x)+1, 1.0))
import numpy as np
import matplotlib.pyplot as plt

x = [0,5,9,10,15]
y = [0,1,2,3,4]
plt.plot(x,y)
plt.xticks(np.arange(min(x), max(x)+1, 1.0))
plt.show()
为了防止min(x)和max(x)是浮点数而不是整数,使用了np.arange而不是Python的range函数。
plt.plot(或 ax.plot)函数会自动设置默认的x和y限制。如果你希望保留这些限制,并且只改变刻度标记的步长,则可以使用ax.get_xlim()来发现Matplotlib已经设置了什么限制。
start, end = ax.get_xlim()
ax.xaxis.set_ticks(np.arange(start, end, stepsize))
默认的刻度格式化程序应该可以很好地将刻度值四舍五入到一个合理的有效数字。但是,如果您希望对格式有更多控制权,可以定义自己的格式化程序。例如,
ax.xaxis.set_major_formatter(ticker.FormatStrFormatter('%0.1f'))
这里有一个可运行的示例:
import numpy as np
import matplotlib.pyplot as plt
import matplotlib.ticker as ticker

x = [0,5,9,10,15]
y = [0,1,2,3,4]
fig, ax = plt.subplots()
ax.plot(x,y)
start, end = ax.get_xlim()
ax.xaxis.set_ticks(np.arange(start, end, 0.712123))
ax.xaxis.set_major_formatter(ticker.FormatStrFormatter('%0.1f'))
plt.show()
plt.xticks(np.arange(min(x), max(x)+1, 1.0))中的+1是必需的,以显示最后一个刻度标记。 - Alex Willisonplt.xticks(np.arange(min(dates), max(dates)+0.1,0.1)?它似乎只绘制年份。 - William Baker Morrison另一种方法是设置轴定位器:
import matplotlib.ticker as plticker

loc = plticker.MultipleLocator(base=1.0) # this locator puts ticks at regular intervals
ax.xaxis.set_major_locator(loc)
根据您的需求,有几种不同类型的定位器可供选择。
以下是一个完整的示例:
import matplotlib.pyplot as plt
import matplotlib.ticker as plticker

x = [0,5,9,10,15]
y = [0,1,2,3,4]
fig, ax = plt.subplots()
ax.plot(x,y)
loc = plticker.MultipleLocator(base=1.0) # this locator puts ticks at regular intervals
ax.xaxis.set_major_locator(loc)
plt.show()
matplotlib.dates.AutoDateLocator()。 - robochatbase=1.0 实际上是什么意思/做什么? - WestCoastProjects我喜欢这个解决方案(来自Matplotlib绘图食谱):
import matplotlib.pyplot as plt
import matplotlib.ticker as ticker

x = [0,5,9,10,15]
y = [0,1,2,3,4]

tick_spacing = 1

fig, ax = plt.subplots(1,1)
ax.plot(x,y)
ax.xaxis.set_major_locator(ticker.MultipleLocator(tick_spacing))
plt.show()
使用 ticker.MultipleLocator() 您可以通过给定的数字显式控制刻度间距,允许自动确定限制并且易于以后阅读。
如果有人对通用的一行代码感兴趣,只需获取当前刻度并使用它来通过每隔一个刻度进行采样来设置新的刻度。
ax.set_xticks(ax.get_xticks()[::2])
ax.set_xticks([tick for tick in ax.get_xticks() if tick % 1 == 0]) 改为:ax.set_xticks([tick for tick in ax.get_xticks() if tick % 1 == 0]) - user2839288如果您只想设置间距并希望代码简洁:
plt.gca().xaxis.set_major_locator(plt.MultipleLocator(1))
同样也可以轻松处理次要刻度:
plt.gca().xaxis.set_minor_locator(plt.MultipleLocator(1))
ax.xaxis.set_major_locator(plt.MultipleLocator(val)) in case you are using fig, ax = plt.subplots() - Alexander这可能有点取巧,但是这是我找到的最干净/易于理解的示例。它来自SO上的答案:
for label in ax.get_xticklabels()[::2]:
    label.set_visible(False)
然后您可以循环标签,根据您想要的密度将它们设置为可见或不可见。
编辑:请注意,有时matplotlib会将标签设置为'',因此可能看起来像标签不存在,实际上它是存在的,只是没有显示任何内容。为了确保您正在循环遍历实际可见的标签,您可以尝试:
visible_labels = [lab for lab in ax.get_xticklabels() if lab.get_visible() is True and lab.get_text() != '']
plt.setp(visible_labels[::2], visible=False)
ax.get_xticklabels()[1::2] 是需要隐藏的标签。 - jolvi'',所以当你循环遍历它们时,你会产生空的不可见的 xticklabels(这对可视化没有影响,但可能意味着你没有获取正确的标签)。你可以尝试:vis_labels = [label for label in ax.get_xticklabels() if label.get_visible() is True]; plt.setp(vis_labels[::2], visible==False) - choldgraf这是一个老话题,但我经常会遇到它,并且已经写了这个函数。它非常方便:
import matplotlib.pyplot as pp
import numpy as np

def resadjust(ax, xres=None, yres=None):
    """
    Send in an axis and I fix the resolution as desired.
    """

    if xres:
        start, stop = ax.get_xlim()
        ticks = np.arange(start, stop + xres, xres)
        ax.set_xticks(ticks)
    if yres:
        start, stop = ax.get_ylim()
        ticks = np.arange(start, stop + yres, yres)
        ax.set_yticks(ticks)
这种控制刻度的方法有一个注意事项,就是在添加新行后不再享受交互式自动更新最大刻度的功能。此时需要执行以下操作:
gca().set_ylim(top=new_top) # for example
并再次运行resadjust函数。
我开发了一个不太优美的解决方案。考虑到我们有X轴,以及每个X点的标签列表。
import matplotlib.pyplot as plt

x = [0,1,2,3,4,5]
y = [10,20,15,18,7,19]
xlabels = ['jan','feb','mar','apr','may','jun']
xlabelsnew = []
for i in xlabels:
    if i not in ['feb','jun']:
        i = ' '
        xlabelsnew.append(i)
    else:
        xlabelsnew.append(i)
plt.plot(x,y)
plt.xticks(range(0,len(x)),xlabels,rotation=45)
plt.show()
plt.plot(x,y)
plt.xticks(range(0,len(x)),xlabelsnew,rotation=45)
plt.show()
以下是所需功能的纯Python实现,可处理任何数字系列(int或float),包括正数、负数或混合值,并允许用户指定所需的步长:
import math

def computeTicks (x, step = 5):
    """
    Computes domain with given step encompassing series x
    @ params
    x    - Required - A list-like object of integers or floats
    step - Optional - Tick frequency
    """
    xMax, xMin = math.ceil(max(x)), math.floor(min(x))
    dMax, dMin = xMax + abs((xMax % step) - step) + (step if (xMax % step != 0) else 0), xMin - abs((xMin % step))
    return range(dMin, dMax, step)
# Negative to Positive
series = [-2, 18, 24, 29, 43]
print(list(computeTicks(series)))

[-5, 0, 5, 10, 15, 20, 25, 30, 35, 40, 45]

# Negative to 0
series = [-30, -14, -10, -9, -3, 0]
print(list(computeTicks(series)))

[-30, -25, -20, -15, -10, -5, 0]

# 0 to Positive
series = [19, 23, 24, 27]
print(list(computeTicks(series)))

[15, 20, 25, 30]

# Floats
series = [1.8, 12.0, 21.2]
print(list(computeTicks(series)))

[0, 5, 10, 15, 20, 25]

# Step – 100
series = [118.3, 293.2, 768.1]
print(list(computeTicks(series, step = 100)))

[100, 200, 300, 400, 500, 600, 700, 800]
import matplotlib.pyplot as plt

x = [0,5,9,10,15]
y = [0,1,2,3,4]
plt.plot(x,y)
plt.xticks(computeTicks(x))
plt.show()
请注意,x轴上的整数值是均匀间隔的5个,而y轴具有不同的间隔(这是由于未指定刻度标记的matplotlib默认行为)。
只需导入Numpy的通用一行代码:
ax.set_xticks(np.arange(min(x),max(x),1))
import numpy as np
import matplotlib.pyplot as plt
fig, ax = plt.subplots()
x = [0,5,9,10,15]
y = [0,1,2,3,4]
ax.plot(x,y)
ax.set_xticks(np.arange(min(x),max(x),1))
plt.show()
工作原理:
fig, ax = plt.subplots() 返回包含轴的ax对象。np.arange(min(x),max(x),1) 返回从x的最小值到最大值之间间隔为1的数组。这是我们想要的新x刻度。ax.set_xticks() 改变ax对象上的刻度。
pyplot.locator_params(nbins=4)。翻译:这是一个与Matplotlib中如何减少刻度数密切相关的问题,并提供了一个很好的解决方法:使用pyplot.locator_params(nbins=4)。请注意,翻译时应尽量保留原文意思和结构,不要添加额外的解释或内容。 - Dr. Jan-Philip Gehrcke