下面的绘图代码出现了“错误:提供了离散值以连续比例尺”的代码。
这段代码有什么问题? 在我尝试更改比例尺时它正常工作,所以错误就在那里... 我试图从类似问题中找到解决方案,但失败了。
绘图代码:
这段代码有什么问题? 在我尝试更改比例尺时它正常工作,所以错误就在那里... 我试图从类似问题中找到解决方案,但失败了。
meltDF <- data.frame(
  MW = c(
    3.9, 6.4, 7.4, 8.1, 9, 9.4, 3.9, 6.4, 7.4, 8.1, 9, 9.4, 3.9, 6.4, 7.4, 8.1, 9,
    9.4, 3.9, 6.4, 7.4, 8.1, 9, 9.4, 3.9, 6.4, 7.4, 8.1, 9, 9.4, 3.9, 6.4, 7.4,
    8.1, 9, 9.4, 3.9, 6.4, 7.4, 8.1, 9, 9.4, 3.9, 6.4, 7.4, 8.1, 9, 9.4, 3.9, 6.4,
    7.4, 8.1, 9, 9.4, 3.9, 6.4, 7.4, 8.1, 9, 9.4, 3.9, 6.4, 7.4, 8.1, 9, 9.4, 3.9,
    6.4, 7.4, 8.1, 9, 9.4, 3.9, 6.4, 7.4, 8.1, 9, 9.4, 3.9, 6.4, 7.4, 8.1, 9, 9.4,
    3.9, 6.4, 7.4, 8.1, 9, 9.4, 3.9, 6.4, 7.4, 8.1, 9, 9.4, 3.9, 6.4, 7.4, 8.1, 9,
    9.4, 3.9, 6.4, 7.4, 8.1, 9, 9.4, 3.9, 6.4, 7.4, 8.1, 9, 9.4, 3.9, 6.4, 7.4,
    8.1, 9, 9.4
  ),
  variable = factor(
    c(
      "10", "10", "10", "10", "10", "10", "33.95", "33.95", "33.95",
      "33.95", "33.95", "33.95", "58.66", "58.66", "58.66", "58.66",
      "58.66", "58.66", "84.42", "84.42", "84.42", "84.42", "84.42",
      "84.42", "110.21", "110.21", "110.21", "110.21", "110.21", "110.21",
      "134.16", "134.16", "134.16", "134.16", "134.16", "134.16", "164.69",
      "164.69", "164.69", "164.69", "164.69", "164.69", "199.1", "199.1",
      "199.1", "199.1", "199.1", "199.1", "234.35", "234.35", "234.35",
      "234.35", "234.35", "234.35", "257.19", "257.19", "257.19", "257.19",
      "257.19", "257.19", "361.84", "361.84", "361.84", "361.84", "361.84",
      "361.84", "432.74", "432.74", "432.74", "432.74", "432.74", "432.74",
      "506.34", "506.34", "506.34", "506.34", "506.34", "506.34", "581.46",
      "581.46", "581.46", "581.46", "581.46", "581.46", "651.71", "651.71",
      "651.71", "651.71", "651.71", "651.71", "732.59", "732.59", "732.59",
      "732.59", "732.59", "732.59", "817.56", "817.56", "817.56", "817.56",
      "817.56", "817.56", "896.24", "896.24", "896.24", "896.24", "896.24",
      "896.24", "971.77", "971.77", "971.77", "971.77", "971.77", "971.77",
      "1038.91", "1038.91", "1038.91", "1038.91", "1038.91", "1038.91"
    ),
    levels = c(
      "10", "33.95", "58.66", "84.42", "110.21", "134.16", "164.69",
      "199.1", "234.35", "257.19", "361.84", "432.74", "506.34", "581.46",
      "651.71", "732.59", "817.56", "896.24", "971.77", "1038.91"
    )
  ),
  value = c(
    0, 0, 0, 0, 0, 0, 0, 0, 0, 0, 0, 0, 0, 0, 0, 0, 0, 0, 0, 0, 0, 0, 0, 0, 0, 0,
    0, 0, 0, 0, 0, 0, 0, 0, 0, 0, 0, 0, 0, 0, 0, 0, 0, 0, 0, 0, 0, 0, 0, 0, 0, 0,
    0, 0, 0, 0, 0, 0, 0, 0, 0, 0, 0, 0, 0, 0, 0, 0, 0, 0, 0, 0, 1, 0, 0, 0, 0, 0,
    0, 0, 0, 0, 0, 0, 0, 0, 0, 0, 0, 0, 0, 0, 0, 0, 0, 1, 0, 0, 0, 1, 0, 0, 0, 0,
    0, 0, 0, 0, 0, 1, 1, 1, 0, 1, 0, 0, 0, 0, 0, 0
  )
)
绘图代码:
## Plotting
ggplot(meltDF[meltDF$value == 1,]) + geom_point(aes(x = MW, y = variable)) +
  scale_x_continuous(limits=c(0, 1200), breaks=c(0, 400, 800, 1200)) +
  scale_y_continuous(limits=c(0, 1200), breaks=c(0, 400, 800, 1200))
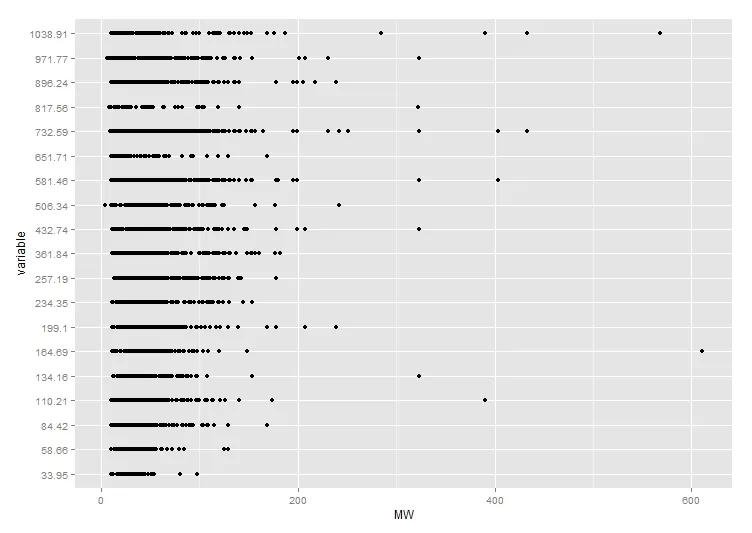
在添加比例尺之前,这是图表的样子:
scale_y_continuous。 - Didzis Elferts