我希望限制绘图的可见y轴范围。为了保留超出此范围的值,我需要将
然而,我还想在绘图外的边距中添加一些文本。为此,我需要关闭裁剪。这会导致超出范围的值在边距外的绘图区域绘制。
有没有办法在边距中绘制文本并剪切到绘图区域?
oob(越界)设置为rescale_none,这很有效。然而,我还想在绘图外的边距中添加一些文本。为此,我需要关闭裁剪。这会导致超出范围的值在边距外的绘图区域绘制。
有没有办法在边距中绘制文本并剪切到绘图区域?
# Data
set.seed(1)
df <- data.frame( x=1:100,y=rnorm(100,mean=1,sd=1) )
# Basic plot
library(ggplot2)
library(scales)
library(grid)
g <- ggplot(df)+
geom_line(aes(x,y))
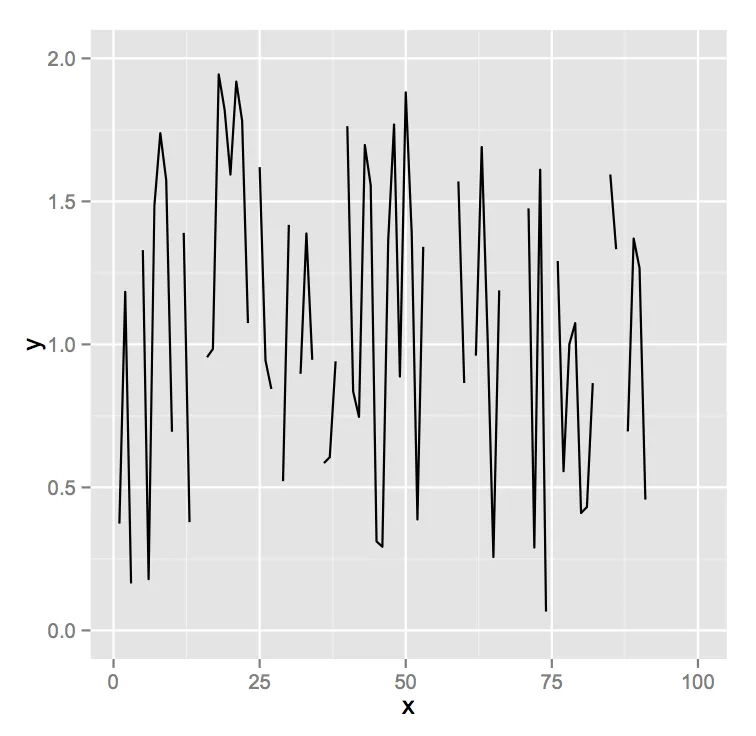
# Values exceeding scale limits are dropped
g1 <- g + scale_y_continuous( limits = c(0,2) )
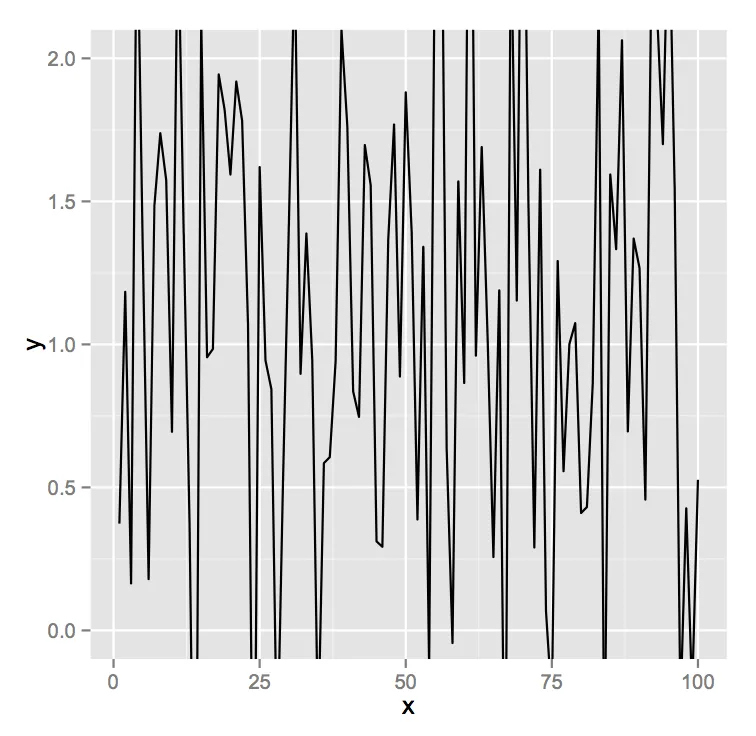
#  This is what I want
g2 <- g + scale_y_continuous( limits = c(0,2) , oob = rescale_none )
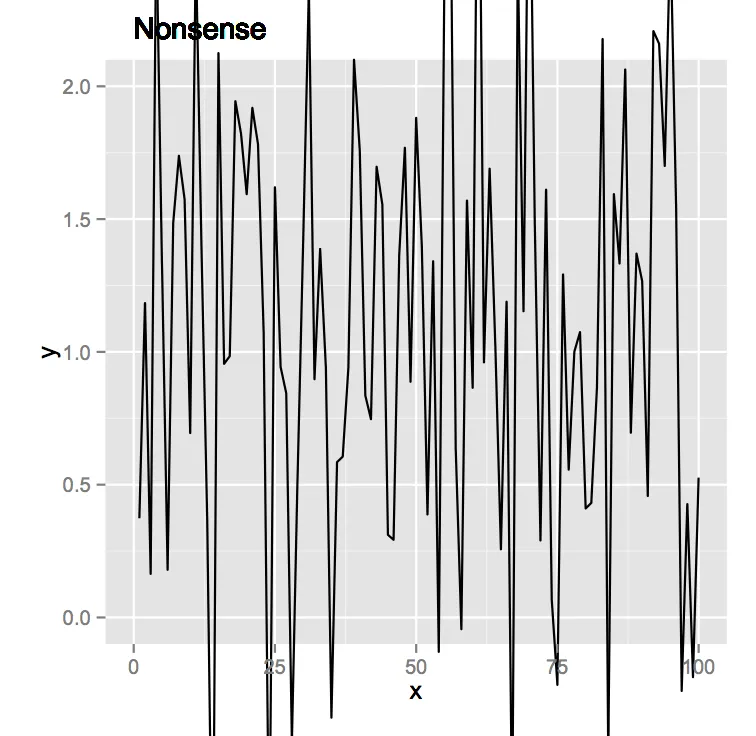
# ...But, I would like to plot some text outside the plotting region
# and need to turn off clipping to get the text to display...
g3 <- g + scale_y_continuous( limits = c(0,2) , oob = rescale_none ) +
# Some text to sit above the plot
geom_text( aes(label = "Nonsense", y = Inf, x = 0), hjust = 0, vjust = -1) +
# Add some space for the text
theme(plot.margin = unit(c(2,1,1,1), "lines"))
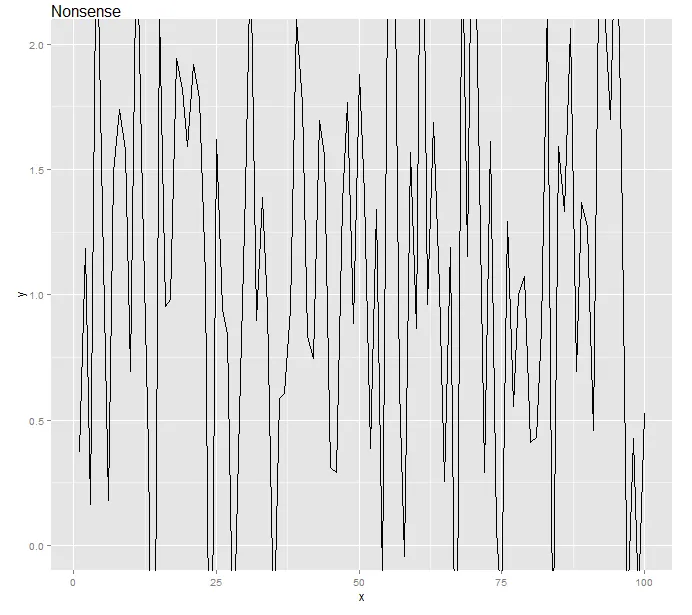
# Turning off clipping makes geom_line also go outside plot area...
# See here for clipping... https://dev59.com/I2ct5IYBdhLWcg3wApCH#12417481
g4 <- ggplot_gtable(ggplot_build(g3))
g4$layout$clip[g4$layout$name == "panel"] <- "off"
grid.draw(g4)