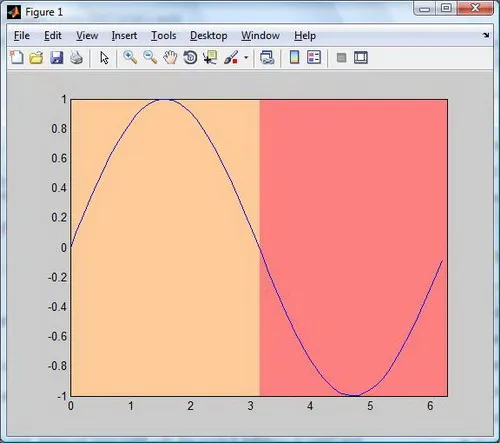
我正在使用MATLAB创建图形,然后对图形的背景进行着色以突出显示某些区域。以下是一个示例:
clc; clear all;

hFig = figure;
y = [0:0.1:2*pi];
x = sin(y);
plot(y,x);
hold on
h(1) = area([0 (2*pi)/2], [1 1],-1);
set(h(1),'FaceColor',[1.0 0.8 0.6],'EdgeColor',[1.0 0.8 0.6]);
h(2) = area([(2*pi)/2 2*pi], [1 1],-1);
set(h(2),'FaceColor',[1.0 0.5 0.5],'EdgeColor',[1.0 0.5 0.5]);
axis tight

set(gca,'children',flipud(get(gca,'children')));

%# centimeters units
X = 14.0;                  %# paper size
Y = 12.0;                  %# paper size
xMargin = 1;               %# left/right margins from page borders
yMargin = 1;               %# bottom/top margins from page borders
xSize = X - 2*xMargin;     %# figure size on paper (widht & hieght)
ySize = Y - 2*yMargin;     %# figure size on paper (widht & hieght)

set(hFig, 'PaperUnits','centimeters')
set(hFig, 'PaperSize',[X Y])
set(hFig, 'PaperPosition',[xMargin yMargin xSize ySize])
set(hFig, 'PaperOrientation','portrait')

print('example','-dpdf','-r0');
在MATLAB中,图像看起来是这样的:
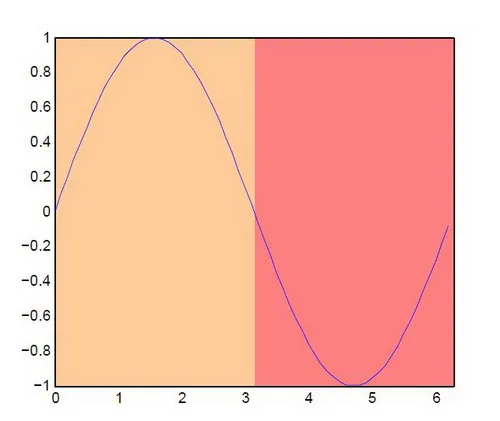
 但生成的PDF文件看起来是这样的:
 是否有一种命令可以强制轴线位于阴影区域之上,就像在MATLAB图中一样?
谢谢。