我对解决方案并不完全满意,因为我没有完全掌握:
- 如何更改线条的大小
- 使用
patchwork::wrap_plots()时,为什么它们与顶部和底部的对齐不完美
- 为什么使用
ggpubr::ggarrange()或cowplot::plot_grid()时它不显示顶部线
但基于this code,我建议以下解决方案:
library(ggplot2)
df <- data.frame(x = 1:5, y = 1:5)
p <- ggplot(data = df) + aes(x, y) + geom_point()
top_line <- grid::grobTree(grid::linesGrob(x = grid::unit(c(0, 1), "npc"), y = grid::unit(1, "npc")))
bot_line <- grid::grobTree(grid::linesGrob(x = grid::unit(c(0, 1), "npc"), y = grid::unit(0, "npc")))
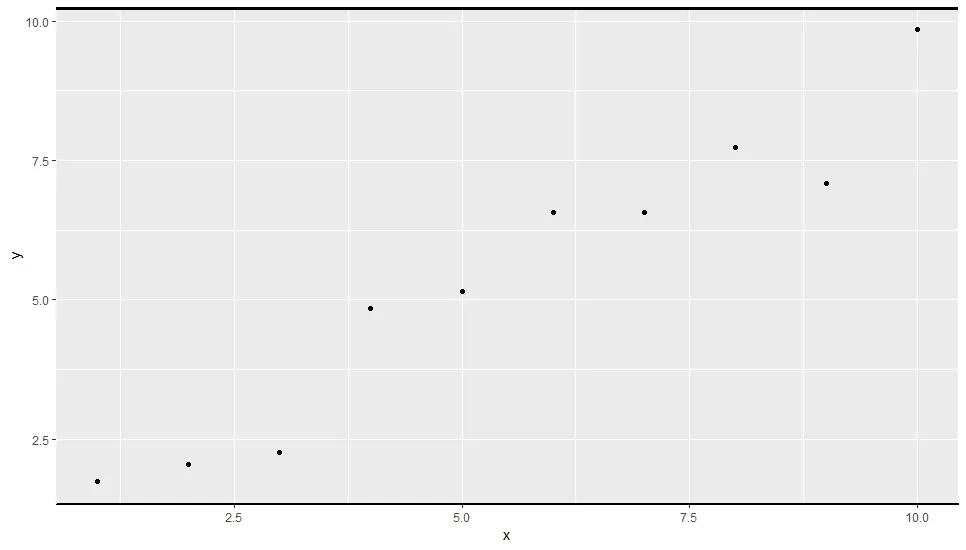
patchwork::wrap_plots(top_line, p, bot_line,
ncol = 1, nrow = 3,
heights = c(0, 1, 0))

ggpubr::ggarrange(top_line, p, bot_line,
                  ncol = 1, nrow = 3,
                  heights = c(0, 1, 0))

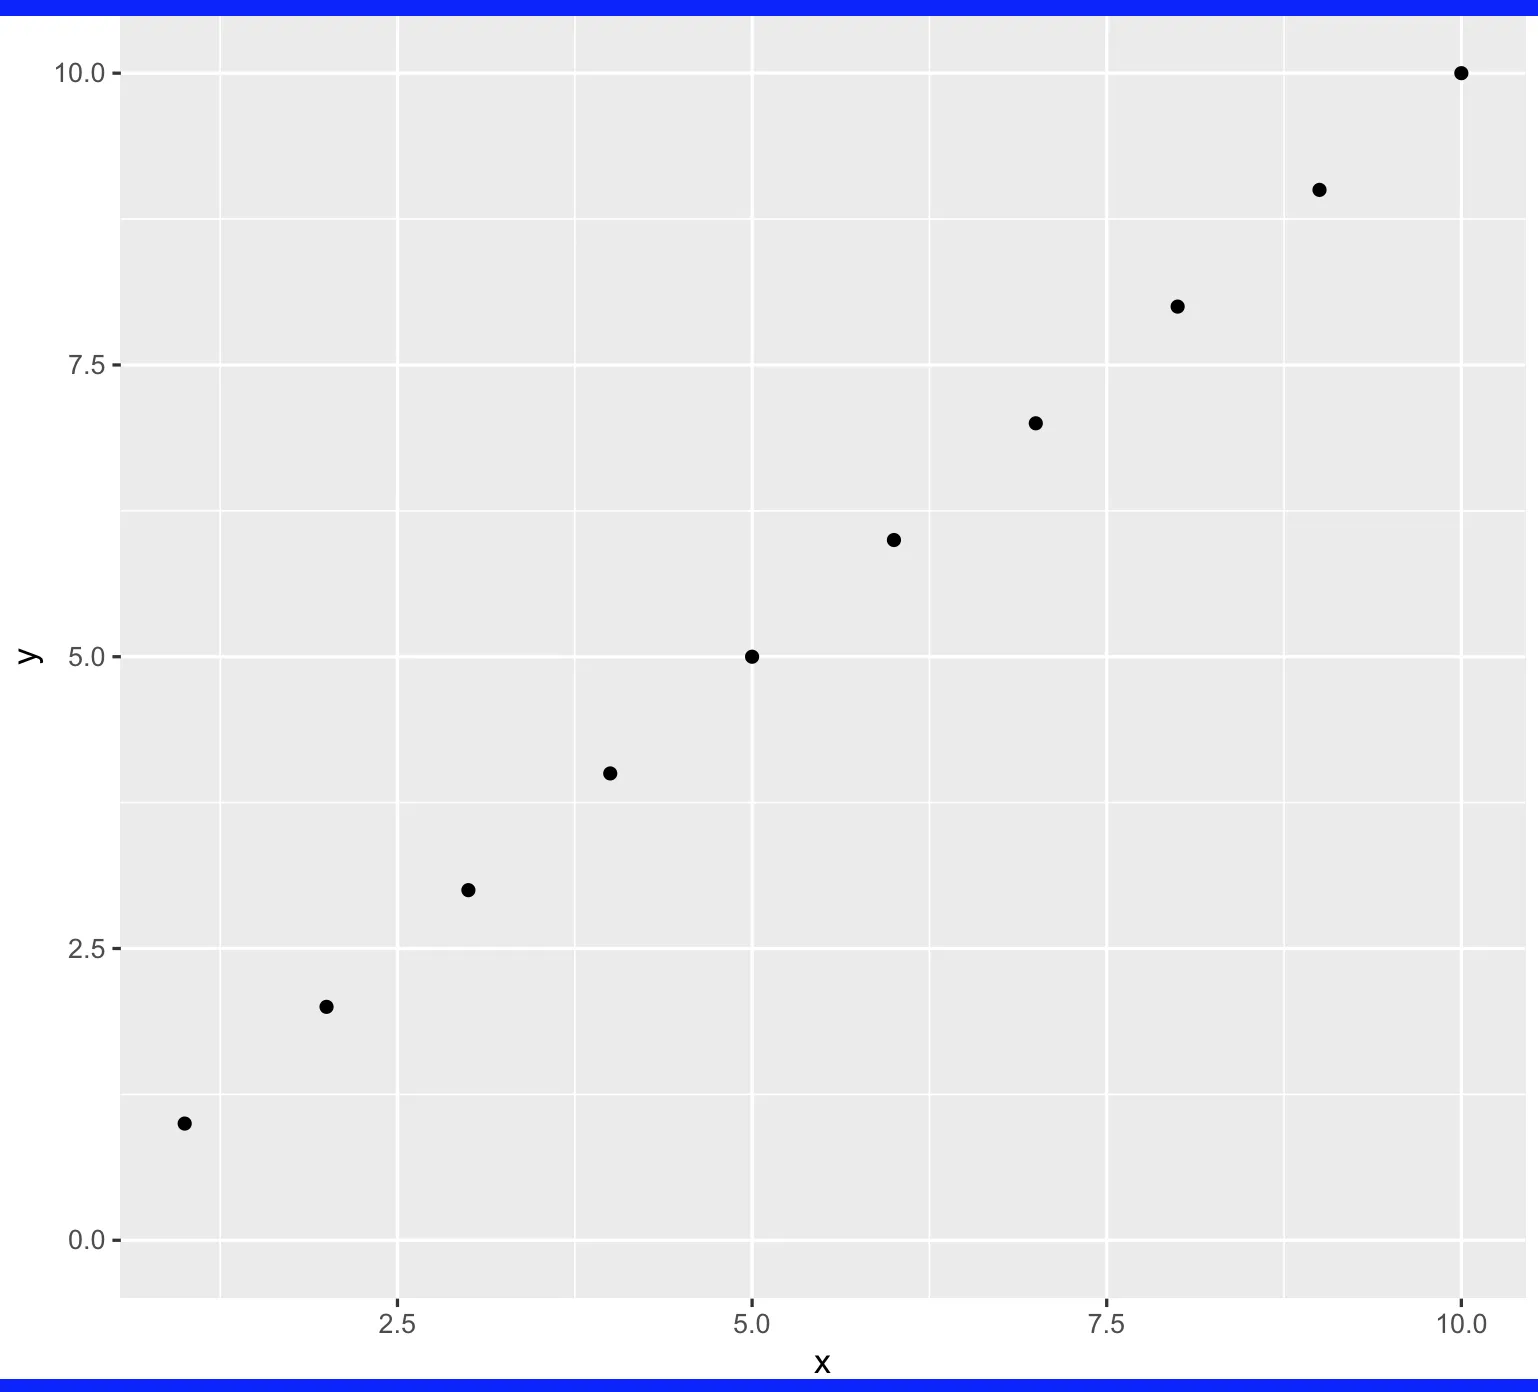
cowplot::plot_grid(top_line, p, bot_line,
                   ncol = 1, nrow = 3,
                   rel_heights = c(0, 1, 0))

使用 reprex v2.0.2 工具于2022年8月25日创建