ggplot的线型导致线条消失

5

我想绘制一些线条,并使它们以颜色和线型区分。如果只区分颜色,那么可以正常显示。但是如果加入线型,组14的线就会消失。

(ggplot2_2.1.0,R版本3.3.1)

library(ggplot2)
g <- paste("Group", 1:14)
group <- factor(rep(g, each=14), levels=g)
x <- rep(1:14, length.out=14*14)
y <- c(runif(14*13), rep(0.55, 14))

d <- data.frame(group, x, y, stringsAsFactors=FALSE)

# Next 2 lines work fine - check the legend for Group 14
ggplot(d, aes(x, y, color=group)) +
  geom_line()

# Add linetype
ggplot(d, aes(x, y, color=group, linetype=group)) +
  geom_line()
# Group 14 is invisible!

发生了什么事情?


我认为你已经用尽了
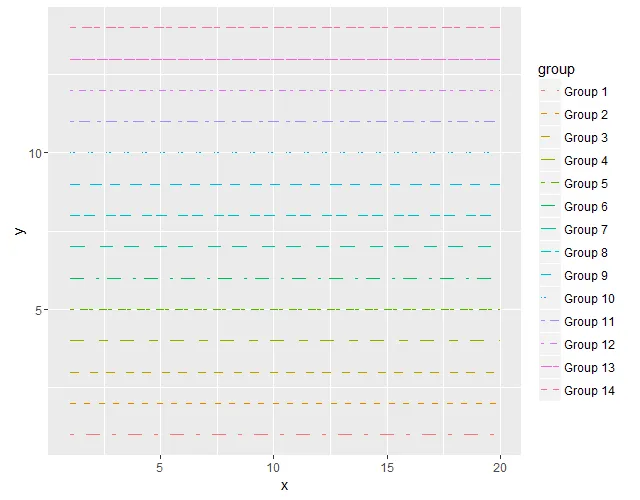
ggplot中不同线条类型的数量,此时的默认行为是对额外的线条使用“blank”。看看如果你进一步增加组数会发生什么。 - ulfelder
scale_linetype_manual(values=1:14) 是我使用的覆盖设置,它可以正常工作。如果我进一步增加组数,就会得到更多的空白。悄悄地默认为空白似乎不是理想的选择。 - harrys
1个回答

1
你可以通过手动使用十六进制字符串来定义每行的形式来解决它(请参见?linetype)。 ?linetype

…,字符串“33”指定了三个单位的连续打开,接着是三个单位的关闭,“3313”指定了三个单位的连续打开,接着是三个单位的关闭,然后是一个打开和最后三个关闭。

HEX <- c(1:9, letters[1:6])  # can't use 0 

 ## make linetype with (two- or) four‐digit number of hex
  # In this example, I made them randomly
set.seed(1); HEXs <- matrix(sample(HEX, 4*14, replace = T), ncol = 4)
my_val <- apply(HEXs, 1, function(x) paste0(x[1], x[2], x[3], x[4]))

 # example data
group <- factor(rep(paste("Group", 1:14), each = 20), levels=paste("Group", 1:14))
data <- data.frame(x = 1:20, y = rep(1:14, each=20), group = group)

ggplot(data, aes(x = x, y = y, colour = group, linetype = group)) +
  geom_line() +
  scale_linetype_manual(values = my_val)

enter image description here


网页内容由stack overflow 提供, 点击上面的
可以查看英文原文,
原文链接