确定ggplot2绘图区域的宽度。

3

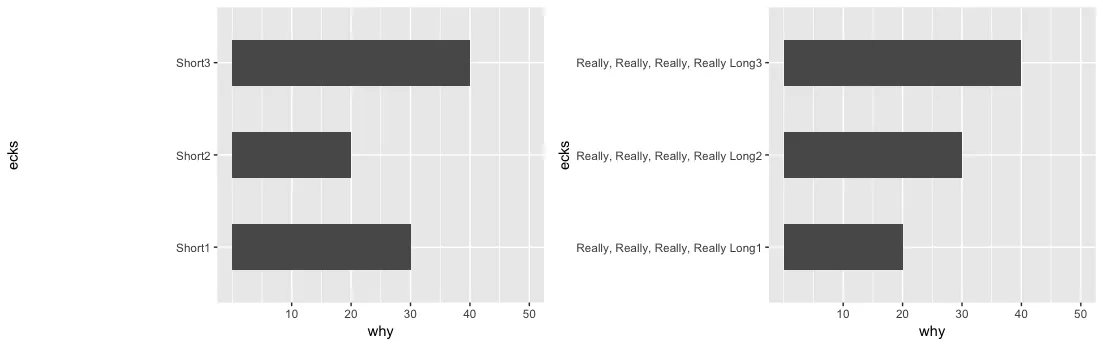
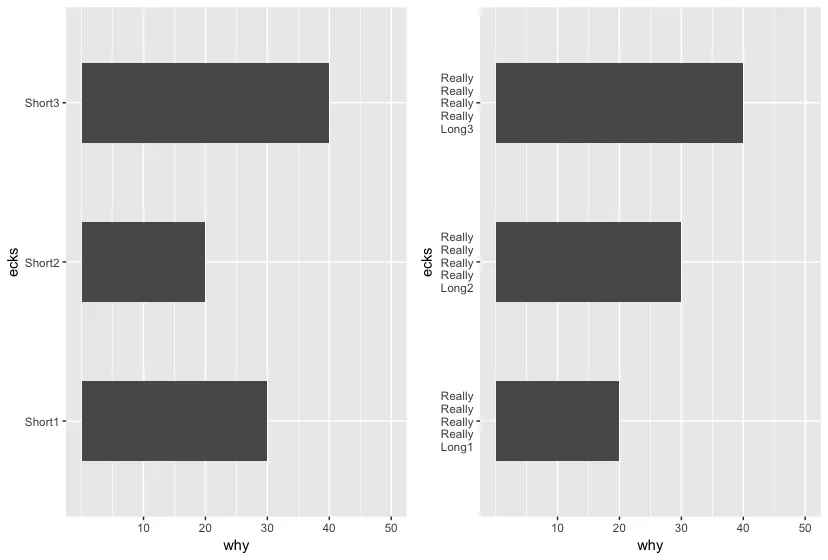
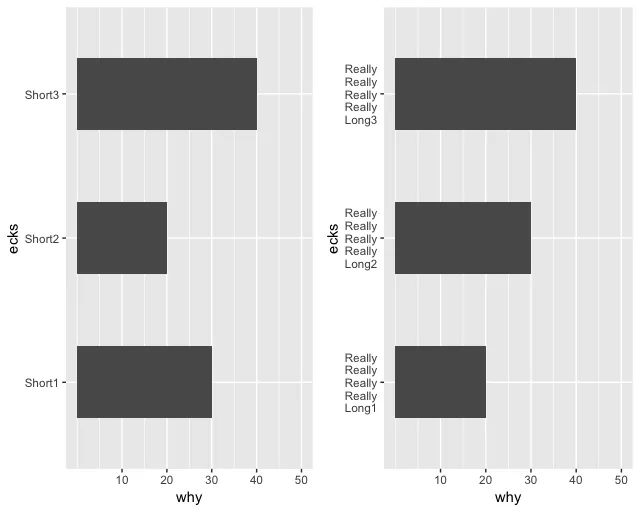
我正在尝试使用gridExtra将两个ggplot2条形图组合在一起(坐标轴翻转,以便标签占用水平空间)。问题是有些标签很短,有些标签很长。我希望左右两列的宽度相同,而不管标签的宽度如何。这是一个例子:

library(ggplot2)
library(gridExtra)

datashort <- data.frame(ecks = c("Short1", "Short2", "Short3"), why = c(30, 20, 40))
datalong <- data.frame(ecks = c(paste0("Really, Really, Really, Really Long", c(1:3))), 
                       why = c(20, 30, 40))

plotshort <- ggplot(data = datashort, aes(x = ecks, y = why, width = .5)) +
  geom_bar(stat = "identity") +
  scale_y_continuous(breaks = c(10, 20, 30, 40, 50), limits = c(0, 50)) +
  coord_flip()

plotlong <- ggplot(data = datalong, aes(x = ecks, y = why, width = .5)) +
  geom_bar(stat = "identity") +
  scale_y_continuous(breaks = c(10, 20, 30, 40, 50), limits = c(0, 50)) +
  coord_flip()

grid.arrange(plotshort, plotlong, ncol = 2)

如果您这样做,您会得到一个非常宽的左侧图表和一个非常紧凑的右侧图表。我知道您可以在网格排列中添加宽度,但我想确切地知道它们应该是什么。在这里看起来像widths=c(.4, .6)效果很好,但并不完全准确。此外,您必须使用试错法才能达到那里,这并不理想。有没有办法找出实际绘图区域,以便您可以计算正确的宽度?
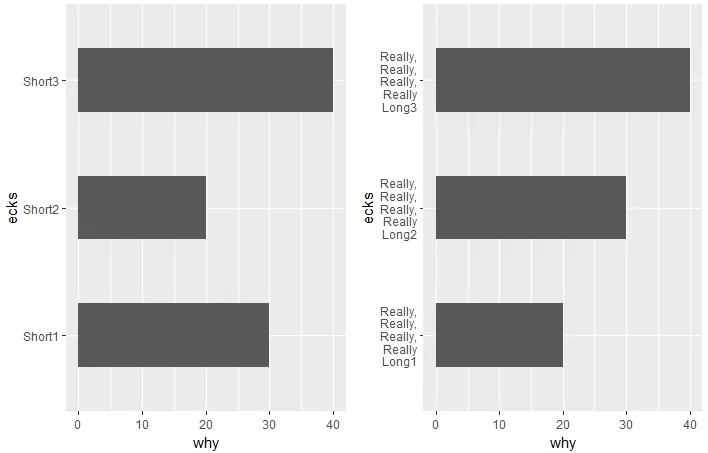
你可以使用 egg::ggarrange - user20650
请查看此帖子:https://stackoverflow.com/questions/17181051/r-ggplot2-size-of-plot-area。在生成图表之前,将标签分成多行可能会有所帮助:`datalong$ecks <- gsub(' ', '\n', datalong$ecks)`。 - Carlos Eduardo Lagosta
2个回答

3
一种非常简单的解决方案是使用cowplot:
cowplot::plot_grid(plotshort, plotlong, ncol = 2,align = "v")

enter image description here

参数align允许您将绘图区域设置为相等。
或者另一种选择是在标题中添加一些换行符:
library(stringr)

plotlong <- datalong %>%
    mutate(ecks = str_replace_all(ecks, "[[:punct:]]\\s|\\s", "\\\n")) %>% 
    ggplot(aes(x = ecks, y = why, width = .5)) +
    geom_bar(stat = "identity") +
    scale_y_continuous(breaks = c(10, 20, 30, 40, 50), limits = c(0, 50)) +
    coord_flip()

cowplot::plot_grid(plotshort, plotlong, ncol = 2,align = "v")

enter image description here

如果您添加了换行符,则可以使用grid.arrange
grid.arrange(plotshort, plotlong, ncol = 2)

enter image description here


我会选择使用cowplot解决方案。谢谢! - Caroline

0

您可以使用stringr包来包装标签,并修改您的ggplot2脚本,以在st_wrap中定义标签并作为scale_x_discrete绘制:

library(stringr)    

plotshort <- ggplot(data = datashort, aes(x = ecks, y = why, width = .5)) +
  geom_bar(stat = "identity") + coord_flip() +
  scale_x_discrete(labels = str_wrap(c("Short1", "Short2", "Short3"), width = 10))  

plotlong <- ggplot(data = datalong, aes(x = ecks, y = why, width = .5)) +
    geom_bar(stat = "identity") + coord_flip() +
    scale_x_discrete(labels = str_wrap(c("Really, Really, Really, Really Long1", "Really, Really, Really, Really Long2", "Really, Really, Really, Really Long3"), width = 10))  

grid.arrange(plotshort, plotlong, ncol = 2)

enter image description here


这个数据可以正常工作,但我实际处理的数据有大约70行,所以包装它们并不方便。此外,这仍然不能使绘图区域大小相等,只是避免了一些挤压。 - Caroline

网页内容由stack overflow 提供, 点击上面的
可以查看英文原文,
原文链接