我需要将多个图表依次放置在一起,并且希望边缘和图形区域的宽度相同,以便它们能够整齐地对齐。请注意,我需要两个单独的图表,而不是一个联合图表。我想将每个图表保存在单独的PNG文件中。我只希望它们的结构(边缘、图形区域大小)相同。
library(ggplot2)
d <- data.frame(label=c("some very longe label with lots of text",
"another long label with lots of text",
"short",
"also short",
" short",
" also short"),
x = 1:6)
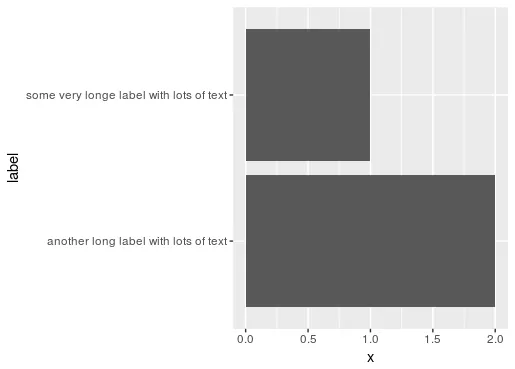
ggplot(d[1:2, ], aes(label, x)) + geom_bar(stat = "identity") + coord_flip()
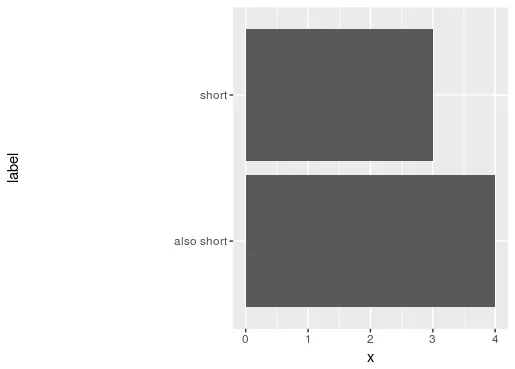
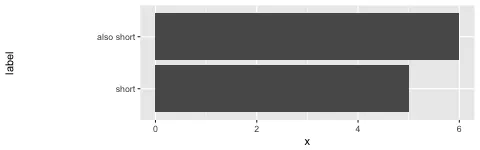
ggplot(d[3:4, ], aes(label, x)) + geom_bar(stat = "identity") + coord_flip()
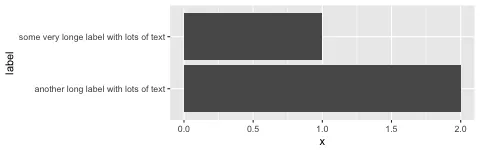
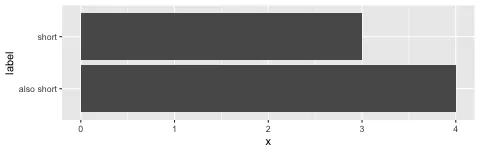
我想让图2的左边距与图1相同,就像下面这样,当然不需要添加额外的空格。
在基础绘图中,我只需要相应地设置par("mar")即可。
在 ggplot 中如何实现这一点?