我使用
facet_wrap来绘制一些数据。以下是一个示例:library (ggplot2)
library (reshape)
# generate some dummy data
x = seq(0,1,0.05)
precision = sqrt(x)
recall = 1 - precision
fmeasure = 2 * (precision * recall) / (precision + recall)
# prepare it for plotting
df = data.frame(x=x, precision=precision, recall=recall, fmeasure=fmeasure)
df = melt(df, id.vars=c(x))
# plot it
p = ggplot(df, aes(x=x, y=value, group=variable))
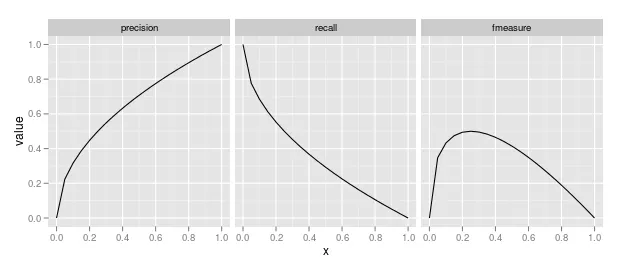
p = p + geom_line() + facet_wrap(~variable, ncol=3)
p = p + coord_cartesian(xlim=c(0,1), ylim=c(0,1)) # second plot is without this line
print (p)
图1:上述代码的绘图。

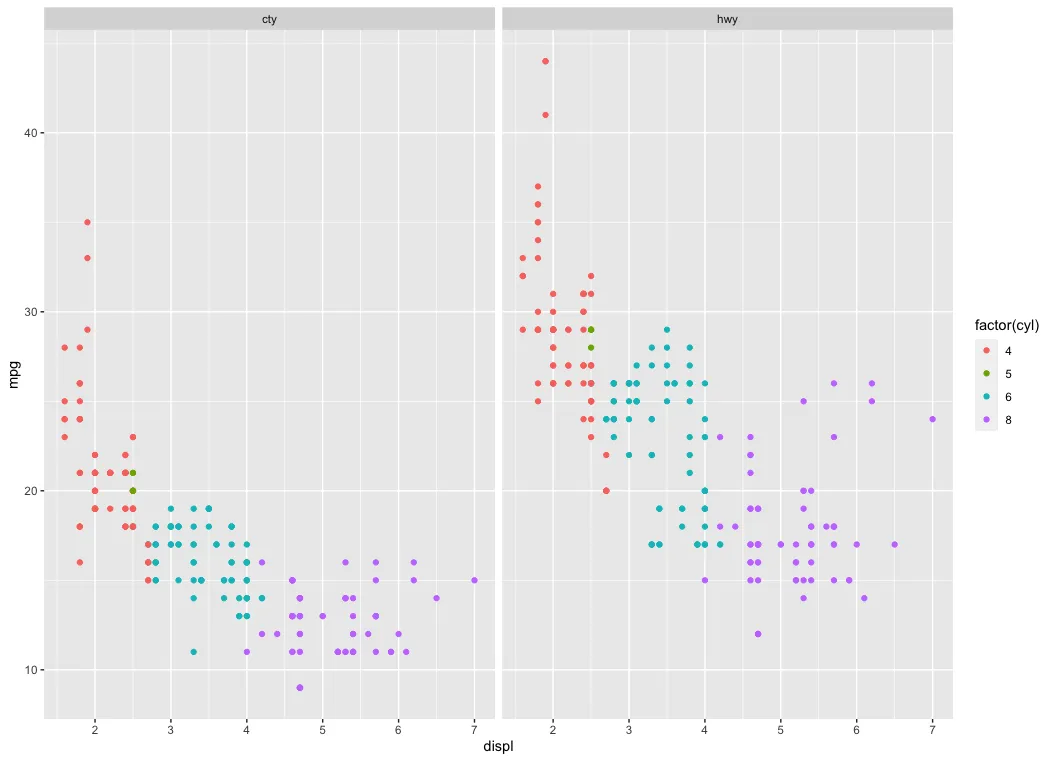
然而,从图1中可以看出,相邻分面的第一个和最后一个标签重叠。可以通过增加分面之间的空间来解决此问题。另一种选择是删除xlim和ylim范围,如图2所示,但这会在分面本身保留不必要的空间。
图2:删除线p = p + coord_cartesian(xlim=c(0,1), ylim=c(0,1))后的绘图。
我尝试增加分面之间的空间,但到目前为止还没有成功。你有什么建议吗?
我使用的是ggplot2版本0.9.1。
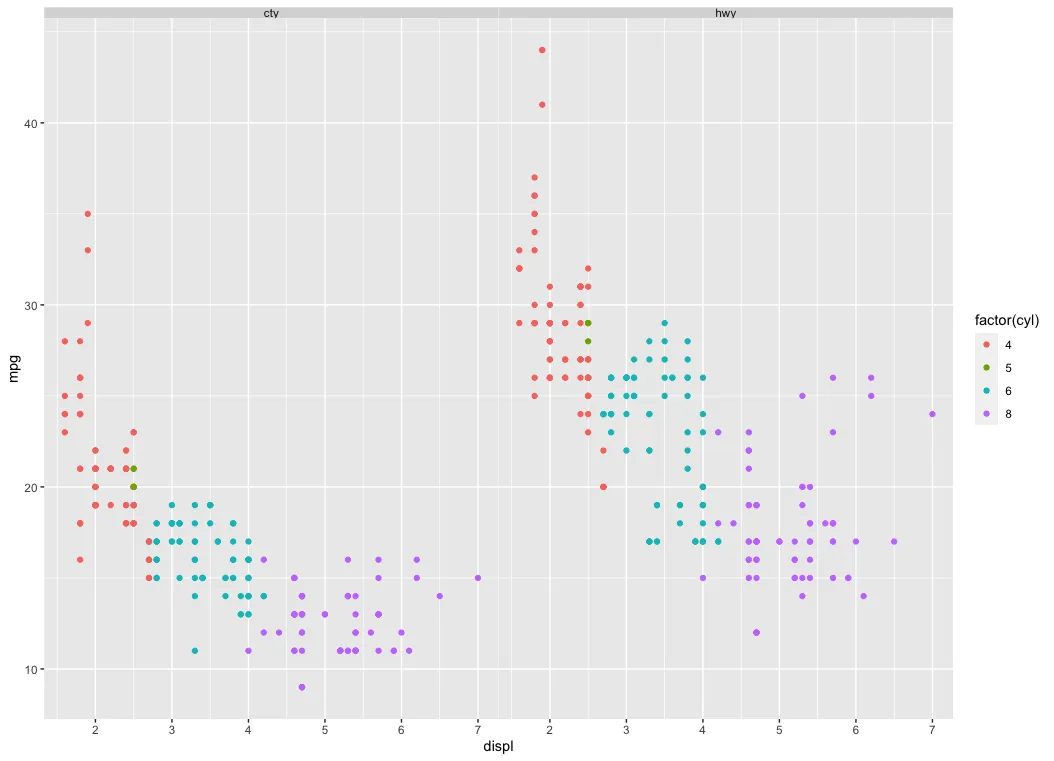
p + opts(panel.margin = unit(2, "lines")),但是你会有很多额外的空白区域,并且在我的看法中会失去一些分面效果(注意0.9.2现在使用theme而不是opts)。 - Tyler Rinker