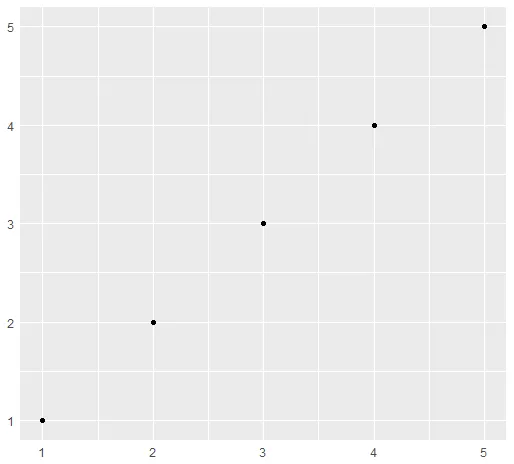
我该如何调整(增加或减少)坐标轴文本(数字)与绘图区域(灰色区域)之间的间距?
dfr <- data.frame(x=1:5,y=1:5)
ggplot(dfr,aes(x,y))+
  geom_point()+
  theme(axis.title=element_blank(),
        axis.ticks=element_blank())
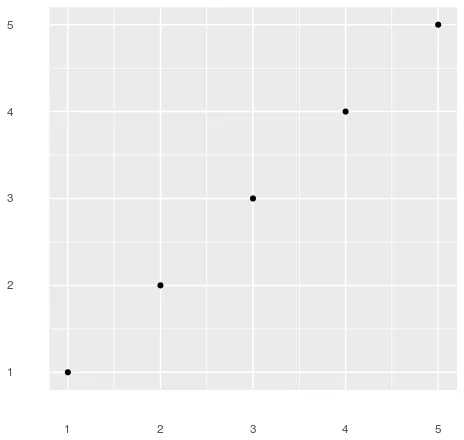
axis.title.y替换为axis.text.y,以实现增加y轴上文本与标题之间的距离。原文链接请见:Increase distance between text and title on the y-axis。 - Henrik