我已经找到了一种令人满意的适应annotation_ticks函数的解决方案。如果我们仅仅从您发布的链接中复制粘贴代码,我们可以在GeomTicks ggproto对象的末尾进行以下小修改:
GeomTicks <- ggproto(
"GeomTicks", Geom,
gTree(children = do.call("gList", ticks), cl = "ticktrimmer")
},
default_aes = aes(colour = "black", size = 0.5, linetype = 1, alpha = 1)
)
接下来我们可以编写一个小函数,通过劫持grid包中的S3通用函数makeContent在绘制前触发的范围之外截取刻度:
library(grid)
makeContent.ticktrimmer <- function(x) {
x$children <- lapply(x$children, function(m) {
x0 <- convertX(m$x0, "npc", valueOnly = T)
x1 <- convertX(m$x1, "npc", valueOnly = T)
y0 <- convertY(m$y0, "npc", valueOnly = T)
y1 <- convertY(m$y1, "npc", valueOnly = T)
if (length(unique(x0)) == 1) {
keep <- y0 >= 0 & y0 <= 1 & y1 >= 0 & y1 <= 1
} else if (length(unique(y0)) == 1) {
keep <- x0 >= 0 & x0 <= 1 & x1 >= 0 & x1 <= 1
} else {
keep <- TRUE
}
m$x0 <- m$x0[keep]
m$y0 <- m$y0[keep]
m$x1 <- m$x1[keep]
m$y1 <- m$y1[keep]
m
})
x
}
现在我们可以进行绘图:
g <- ggplot(iris, aes(Sepal.Width, Sepal.Length)) +
  geom_point(aes(colour = Species)) +
  annotation_ticks(long = -1 * unit(0.3, "cm"),
                   mid = -1 * unit(0.2, "cm"),
                   short = -1 * unit(0.1, "cm")) +
  coord_cartesian(clip = "off")
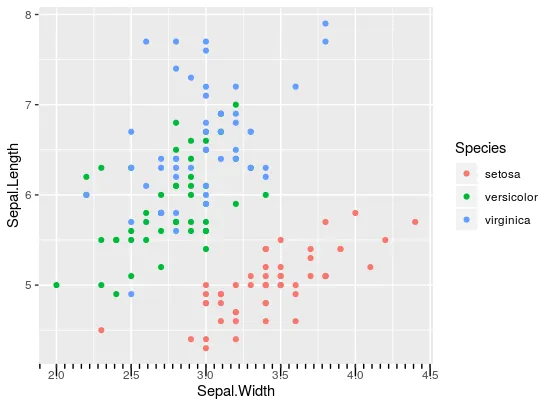
除了最左边的第一个刻度有点奇怪之外,这个看起来还是很不错的。
编辑:这里有一个快速重构代码的方法,使用本地的小间隔而不是重新计算小间隔。用户函数:
annotation_ticks <- function(sides = "b",
scale = "identity",
scaled = TRUE,
ticklength = unit(0.1, "cm"),
colour = "black",
size = 0.5,
linetype = 1,
alpha = 1,
color = NULL,
ticks_per_base = NULL,
...) {
if (!is.null(color)) {
colour <- color
}
if (grepl("[^btlr]", sides)) {
stop(gsub("[btlr]", "", sides), " is not a valid side: b,t,l,r are valid")
}
sides <- strsplit(sides, "")[[1]]
if (length(sides) != length(scale)) {
if (length(scale) == 1) {
scale <- rep(scale, length(sides))
} else {
stop("Number of scales does not match the number of sides")
}
}
base <- sapply(scale, function(x) switch(x, "identity" = 10, "log10" = 10, "log" = exp(1)), USE.NAMES = FALSE)
if (missing(ticks_per_base)) {
ticks_per_base <- base - 1
} else {
if ((length(sides) != length(ticks_per_base))) {
if (length(ticks_per_base) == 1) {
ticks_per_base <- rep(ticks_per_base, length(sides))
} else {
stop("Number of ticks_per_base does not match the number of sides")
}
}
}
delog <- scale %in% "identity"
layer(
data = data.frame(x = NA),
mapping = NULL,
stat = StatIdentity,
geom = GeomTicks,
position = PositionIdentity,
show.legend = FALSE,
inherit.aes = FALSE,
params = list(
base = base,
sides = sides,
scaled = scaled,
ticklength = ticklength,
colour = colour,
size = size,
linetype = linetype,
alpha = alpha,
ticks_per_base = ticks_per_base,
delog = delog,
...
)
)
}
ggproto对象:
GeomTicks <- ggproto(
"GeomTicks", Geom,
extra_params = "",
handle_na = function(data, params) {
data
},
draw_panel = function(data,
panel_scales,
coord,
base = c(10, 10),
sides = c("b", "l"),
scaled = TRUE,
ticklength = unit(0.1, "cm"),
ticks_per_base = base - 1,
delog = c(x = TRUE, y = TRUE)) {
ticks <- list()
for (s in 1:length(sides)) {
if (grepl("[b|t]", sides[s])) {
xticks <- panel_scales$x.minor
if (grepl("b", sides[s])) {
ticks$x_b <- with(
data,
segmentsGrob(
x0 = unit(xticks, "npc"),
x1 = unit(xticks, "npc"),
y0 = unit(0, "npc"),
y1 = ticklength,
gp = gpar(
col = alpha(colour, alpha),
lty = linetype,
lwd = size * .pt
)
)
)
}
if (grepl("t", sides[s])) {
ticks$x_t <- with(
data,
segmentsGrob(
x0 = unit(xticks, "npc"),
x1 = unit(xticks, "npc"),
y0 = unit(1, "npc"),
y1 = unit(1, "npc") - ticklength,
gp = gpar(
col = alpha(colour, alpha),
lty = linetype,
lwd = size * .pt
)
)
)
}
}
if (grepl("[l|r]", sides[s])) {
yticks <- panel_scales$y.minor
if (grepl("l", sides[s])) {
ticks$y_l <- with(
data,
segmentsGrob(
y0 = unit(yticks, "npc"),
y1 = unit(yticks, "npc"),
x0 = unit(0, "npc"),
x1 = ticklength,
gp = gpar(
col = alpha(colour, alpha),
lty = linetype, lwd = size * .pt
)
)
)
}
if (grepl("r", sides[s])) {
ticks$y_r <- with(
data,
segmentsGrob(
y0 = unit(yticks, "npc"),
y1 = unit(yticks, "npc"),
x0 = unit(1, "npc"),
x1 = unit(1, "npc") - ticklength,
gp = gpar(
col = alpha(colour, alpha),
lty = linetype,
lwd = size * .pt
)
)
)
}
}
}
gTree(children = do.call("gList", ticks))
},
default_aes = aes(colour = "black", size = 0.5, linetype = 1, alpha = 1)
)
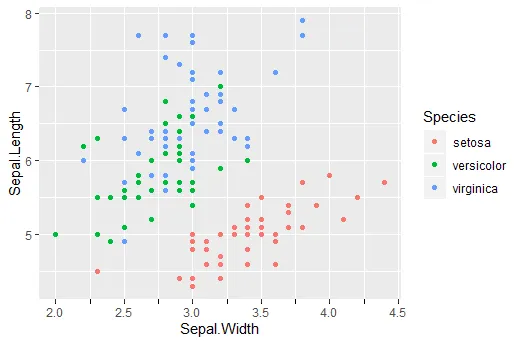
绘图:
ggplot(iris, aes(Sepal.Width, Sepal.Length)) +
  geom_point(aes(colour = Species)) +
  annotation_ticks(ticklength = -1 * unit(0.1, "cm"),
                   side = "b") +
  coord_cartesian(clip = "off")
calc_ticks,但我不熟悉那段代码在做什么。如果你在这个语句中注释掉minpow和maxpow:majorTicks <- sort( unique( c( minpow, regScale[which(regScale %in% majorTicks)], maxpow, majorTicks ) ) ),奇怪的刻度会消失,但同时也会消失超出最后一个主要断点的部分。 - undefinedcalc_ticks版本 - 似乎代码是从annotation_logticks改编而来,后者需要更复杂的计算来确定刻度位置。 - undefinedminor_breaks参数来调整次要刻度,例如在scale_x_continuous中。 非常感谢你的努力!我认为,在未来的ggplot2版本中应该实现次要刻度。然而,你提出的解决方案是一个非常有用的权宜之计,只要在ggplot2中没有这样的实现。 - undefined