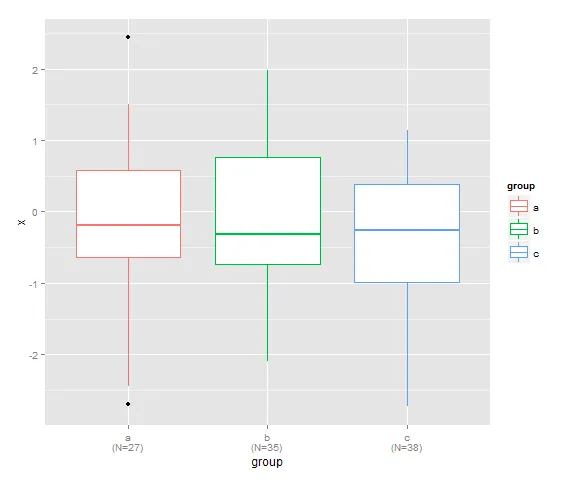
我已经成功创建了一个非常好的箱线图(针对我的目的),按照我之前在这里发布的答案,将其分类并分组:
ggplot: arranging boxplots of multiple y-variables for each group of a continuous x
现在,我想根据每个箱线图中的观察数量自定义x轴标签。
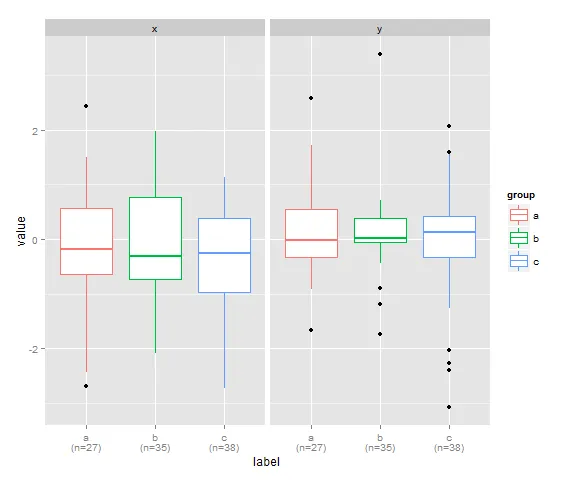
这为每个箱线图提供可能被标记的刻度线。然而,在scale_x_discrete中使用标签只会在每个局面中重复dfmelt_length$value的前四个值。
有什么方法可以避免这种情况发生呢?
谢谢,Sina
require (ggplot2)
require (plyr)
library(reshape2)

set.seed(1234)
x<- rnorm(100)
y.1<-rnorm(100)
y.2<-rnorm(100)
y.3<-rnorm(100)
y.4<-rnorm(100)

df<- (as.data.frame(cbind(x,y.1,y.2,y.3,y.4)))
dfmelt<-melt(df, measure.vars = 2:5)

dfmelt$bin <- factor(round_any(dfmelt$x,0.5))

dfmelt.sum<-summary(dfmelt$bin)

ggplot(dfmelt, aes(x=bin, y=value, fill=variable))+
geom_boxplot()+
facet_grid(.~bin, scales="free")+
labs(x="number of observations")+
scale_x_discrete(labels= dfmelt.sum)
dfmelt.sum只会给出每个箱子中的总观测数,而不是每个箱线图的观测数。箱线图统计数据可以给出每个箱线图的观测数。
dfmelt.stat<-boxplot(value~variable+bin, data=dfmelt)
dfmelt.n<-dfmelt.stat$n
但是,我如何为每个箱线图添加刻度标记和标签呢?
谢谢,Sina
更新
我已经继续在这方面工作。最大的问题是,在上面的代码中,每个小区域只提供一个刻度标记。由于我还想为每个箱线图绘制均值,因此我使用交互式方法单独绘制了每个箱线图,并在x轴上为每个箱线图添加了刻度标记:
require (ggplot2)
require (plyr)
library(reshape2)

set.seed(1234) x<- rnorm(100)
y.1<-rnorm(100)
y.2<-rnorm(100)
y.3<-rnorm(100)
y.4<-rnorm(100)

df<- (as.data.frame(cbind(x,y.1,y.2,y.3,y.4))) dfmelt<-melt(df, measure.vars = 2:5)

dfmelt$bin <- factor(round_any(dfmelt$x,0.5))

dfmelt$f2f1<-interaction(dfmelt$variable,dfmelt$bin)

dfmelt_mean<-aggregate(value~variable*bin, data=dfmelt, FUN=mean)
dfmelt_mean$f2f1<-interaction(dfmelt_mean$variable, dfmelt_mean$bin)

dfmelt_length<-aggregate(value~variable*bin, data=dfmelt, FUN=length)
dfmelt_length$f2f1<-interaction(dfmelt_length$variable, dfmelt_length$bin)
顺便说一下:也许有一种更优雅的方法来组合所有这些交互。我很乐意改进。
ggplot(aes(y = value, x = f2f1, fill=variable), data = dfmelt)+
geom_boxplot()+
geom_point(aes(x=f2f1, y=value),data=dfmelt_mean, color="red", shape=3)+
facet_grid(.~bin, scales="free")+
labs(x="number of observations")+
scale_x_discrete(labels=dfmelt_length$value)
这为每个箱线图提供可能被标记的刻度线。然而,在scale_x_discrete中使用标签只会在每个局面中重复dfmelt_length$value的前四个值。
有什么方法可以避免这种情况发生呢?
谢谢,Sina