使用ggplot来对齐箱线图和折线图的x轴

4

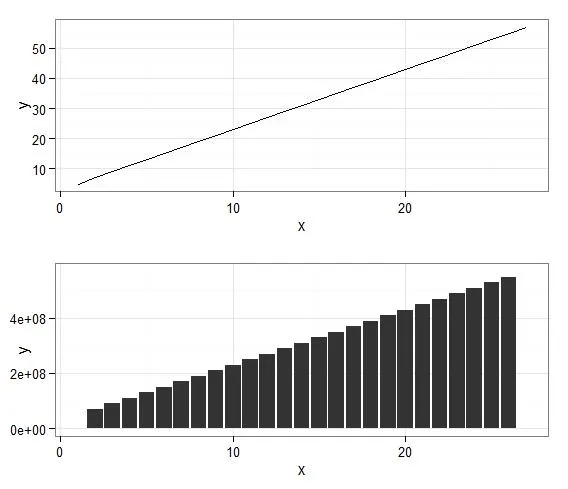
我正在尝试使用ggplot将条形图和折线图的x轴对齐在一个窗口框架中。以下是我想要用假数据完成的内容。

library(ggplot2)
library(gridExtra)
m <- as.data.frame(matrix(0, ncol = 2, nrow = 27))
colnames(m) <- c("x", "y")
for( i in 1:nrow(m))
{
  m$x[i] <- i
  m$y[i] <- ((i*2) + 3)
}

My_plot <- (ggplot(data = m, aes(x = x, y = y)) + theme_bw())
Line_plot <- My_plot + geom_line()
Bar_plot <- My_plot + geom_bar(stat = "identity")

grid.arrange(Line_plot, Bar_plot)

感谢您的帮助。
2个回答

7
@eipi10回答了这个特定情况,但通常情况下,您还需要使图形宽度相等。例如,如果其中一个绘图的y标签所占用的空间比另一个多,即使在每个绘图上使用相同的轴,当传递给grid.arrange时,它们也不会对齐:
axis <- scale_x_continuous(limits=range(m$x))

Line_plot <- ggplot(data = m, aes(x = x, y = y)) + theme_bw() + axis + geom_line()

m2 <- within(m, y <- y * 1e7)
Bar_plot <- ggplot(data = m2, aes(x = x, y = y)) + theme_bw() + axis + geom_bar(stat = "identity")

grid.arrange(Line_plot, Bar_plot)

在这种情况下,您需要使图表宽度相等:
Line_plot <- ggplot_gtable(ggplot_build(Line_plot))
Bar_plot <- ggplot_gtable(ggplot_build(Bar_plot))

Bar_plot$widths <-Line_plot$widths 

grid.arrange(Line_plot, Bar_plot)

enter image description here


这种方法是否也适用于使用高度来对齐每个图的y轴? - JakeC
我想象一下。试试看? - Matthew Plourde
@JakeConway 是的,它可以。但是请参考这个答案,以获取更简洁的方法:https://dev59.com/VYvda4cB1Zd3GeqPX1XQ#30492601 - Matthew Plourde

1
如果您使用scale_x_continuous强制ggplot使用您指定的限制,x轴上的网格线将对齐。
My_plot <- ggplot(data = m, aes(x = x, y = y)) + theme_bw() + 
              scale_x_continuous(limits=range(m$x))

现在,当您添加图层时,坐标轴将共享公共缩放。

网页内容由stack overflow 提供, 点击上面的
可以查看英文原文,
原文链接