如何在R中为盒式图的x轴标签进行旋转?我知道要使用的代码,但无法应用:
text(**????**, par("usr")[3] - 0.25, srt = 45, adj = 1, labels = labels, xpd = TRUE)
在我用问号标示的地方应该填什么变量?我创建了这个箱线图:
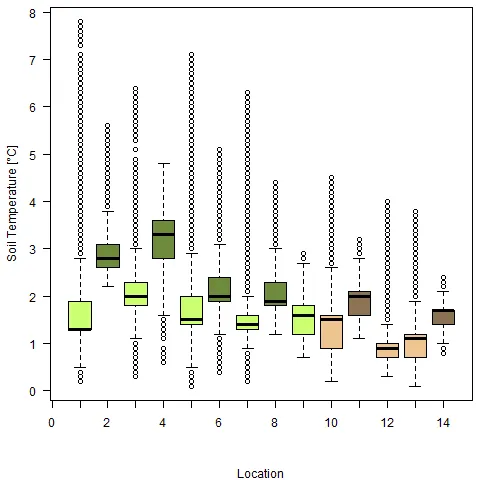
使用下列代码:
soil=read.csv("soil_temp_boxplot.csv", header=TRUE, sep=";")
tiff("soil_boxplot.tiff")
par(mar=c(5.5,3.5,0.5,0.5))
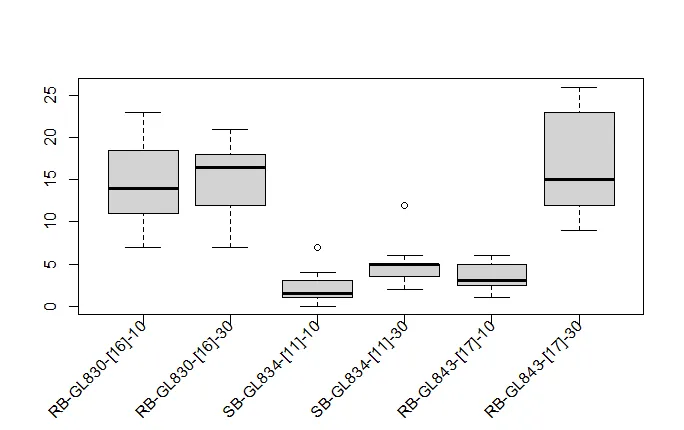
labels<-paste(c("RB-GL830-[16]-10","RB-GL830-[16]-30", "SB-GL834-[11]-10","SB-GL834-[11]-30", "RB-GL843-[17]-10","RB-GL843-[17]-30","SB-GL864-[12]-10","SB-GL864-[12]-30","SB-GL989-[10]-30", "RB-F844-[18]-10", "RB-F844-[18]-30", "SBB-F-864-[14]-10","SB-F991-[13]-10", "SB-F991-[13]-30"))
boxplot(soil$rb.gl.10.830.16, soil$rb.gl.30.830.16, soil$sb.gl.10.834.11, soil$sb.gl.30.834.11, soil$rb.gl.10.843.17, soil$rb.gl.30.843.17, soil$sb.gl.10.864.12, soil$sb.gl.30.864.12, soil$sb.gl.30.989.10, soil$rb.f.10.844.18, soil$rb.f.30.844.18, soil$sbb.f.10.864.14, soil$sb.f.10.991.13, soil$sb.f.30.991.13, yaxt="n", col=c("darkolivegreen1","darkolivegreen4","darkolivegreen1","darkolivegreen4","darkolivegreen1","darkolivegreen4","darkolivegreen1","darkolivegreen4","darkolivegreen1","burlywood2","burlywood4","burlywood2","burlywood2", "burlywood4"))
axis(1, labels = TRUE)
axis(2, c(0, 8, c(1, 2, 3, 4, 5,6,7)), las=1)
text(labels, par("usr")[3] - 0.25, srt = 45, adj = 1, labels = labels, xpd = TRUE)
mtext(2, text="Soil Temperature [°C]", line=2.2)
mtext(1, text="Location", line=4.5)
dev.off()
y = par("usr")[3] - 1的效果不佳。更好的方法是使用y = par("usr")[3] - (par("usr")[4] - par("usr")[3])/30,其中30是要用作标签和轴之间空间的高度比例。在任何比例尺下都可以正常工作 :) - Tomas