我有一个包含CSV文件的文件夹,每个文件都有两列数据,例如:
0,red
15.657,red
0,red
0,red
4.429,red
687.172,green
136.758,green
15.189,red
0.152,red
23.539,red
0.348,red
0.17,blue
0.171,red
0,red
61.543,green
0.624,blue
0.259,red
338.714,green
787.223,green
1.511,red
0.422,red
9.08,orange
7.358,orange
25.848,orange
29.28,orange
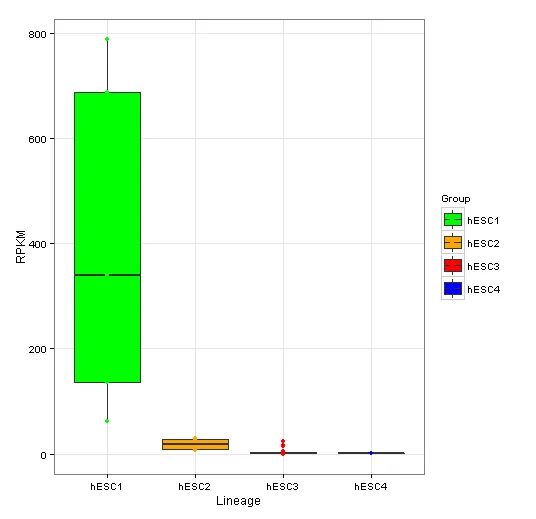
我正在使用以下R代码生成箱线图:
files <- list.files(path="D:/Ubuntu/BoxPlots/test/", pattern=NULL, full.names=F, recursive=FALSE)
files.len<-length(files)
col_headings<-c("RPKM", "Lineage")

for (i in files){
  i2<-paste(i,"png", sep=".")
  boxplots<-read.csv(i, header=FALSE)
  names(boxplots)<-col_headings
  png(i2)
  bplot<-ggplot(boxplots, aes(Lineage, RPKM)) + geom_boxplot(aes(fill=factor(Lineage))) + geom_point(aes(colour=factor(Lineage)))
  print(bplot)
  graphics.off()
}
现在我想要改变箱线图的颜色,使其与相应的x轴标签颜色匹配。我还想改变x轴标签的名称和顺序。是否可以使用ggplot或qplot来实现这一点?