我想用此数据集创建箱线图,按"mix"因素分面(3个箱线图组合):
daf <- read.table("http://pastebin.com/raw.php?i=xxYjmdgD", header=T, sep="\t")
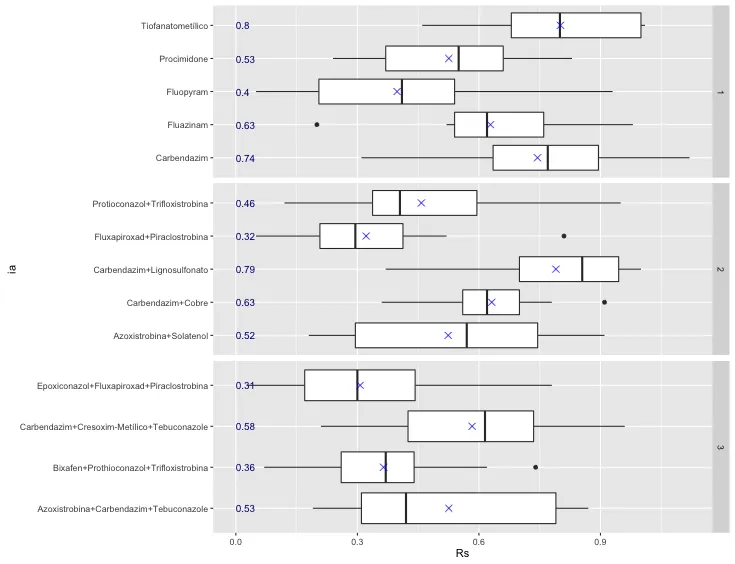
以下是示例的样子:
                                            ia mix   Rs
1                                    Fluazinam   1 0.62
2                                    Fluazinam   1 0.76
3                                    Fluazinam   1 0.76
4                                    Fluazinam   1 0.52
5                                    Fluazinam   1 0.56
6                                    Fluazinam   1 0.20
7                                    Fluazinam   1 0.98
235 Carbendazim+Cresoxim-Metílico+Tebuconazole   3 0.65
236 Carbendazim+Cresoxim-Metílico+Tebuconazole   3 0.28
237 Carbendazim+Cresoxim-Metílico+Tebuconazole   3 0.41
这些是我失败的尝试!
library(ggplot2)

qplot( Rs, ia, data=daf) +
  facet_grid(mix ~ ., scales = "free", space = "free", labeller = label_both)
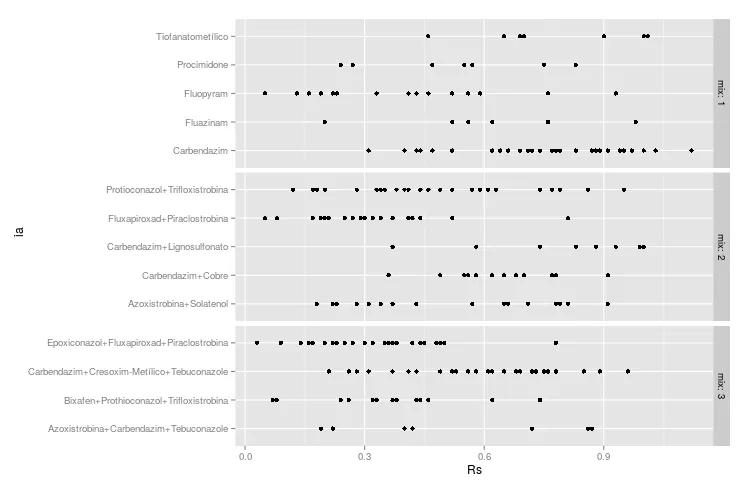
当我添加qplot(Rs, ia, data=daf, geom="boxplot")时,只会出现一条线,而不是盒形图。
ggplot(data=daf, aes(x=ia, y=Rs))+
  geom_boxplot(outlier.colour = "black", outlier.size = 2)  +
  coord_flip() +  theme_bw() +
  scale_y_continuous(breaks=seq(0,1,by=0.25))+
  stat_summary(fun.y = mean, geom="point", shape = 4, size = 3, colour = "blue") +
  facet_grid(mix ~. , scales = "free", space="free", labeller = label_both)
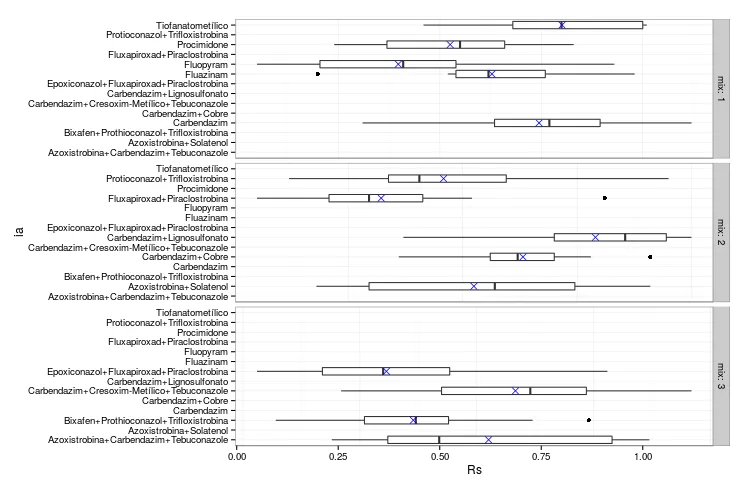
» 它将每个“ia”级别重复到每个“mix”级别中
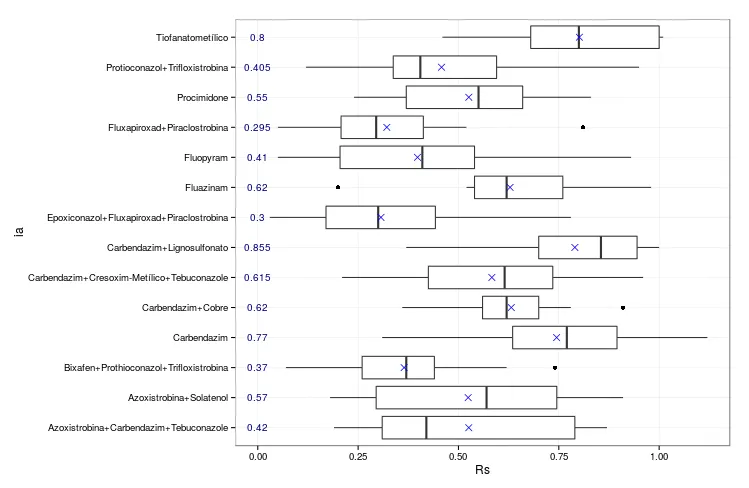
ggplot(data=daf, aes(x=ia, y=Rs))+
  geom_boxplot(outlier.colour = "black", outlier.size = 2)  +
  layer(data = a, mapping = aes(x = ia, y= 0, label=a$Rs.median),
        geom = "text", color="NavyBlue", size=3.5) +
  coord_flip() +  theme_bw() +
  scale_y_continuous(breaks=seq(0,1,by=0.25))+
  stat_summary(fun.y = mean, geom="point", shape = 4, size = 3, colour = "blue")
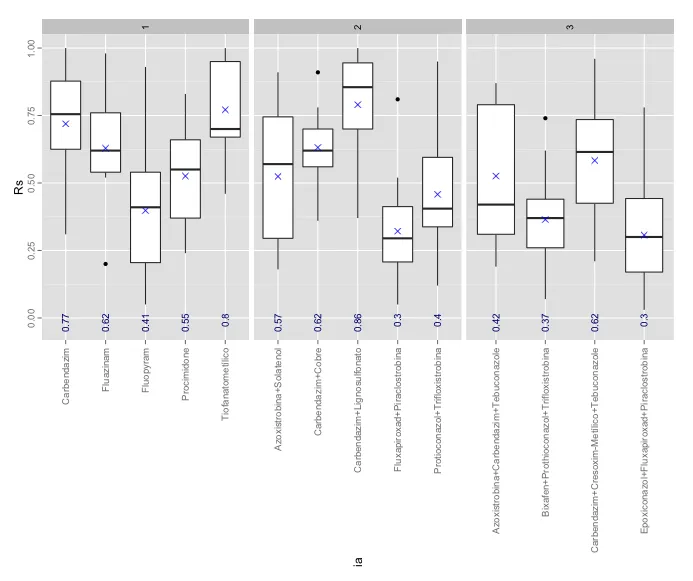
最后,我想将这三个绘图结合起来:
从第一个图中获取facet.grid(不重复使用“ia”变量),从第二个图中获取boxes,在第三个图中获取左内边距中的中位数值,如果可能,请在“mix”因子的每个级别中按中位数值重新排序“ia”...
有人能帮我解决吗?
提前感谢!
vjust=0.5,这样它们就会居中显示在刻度线下方。此外,你可以将x轴标题旋转90度,这样一旦整个图形被旋转,它就会处于所需的方向。 - eipi10Error in layer(data = a, mapping = aes(x = ia, y = 0.02, label = round(Rs, : unused arguments (color = "NavyBlue", size = 3.5, angle = 90, hjust = 1, scale = "free_x")。如果我只使用layer(data = a, mapping = aes(x = ia, y= 0.02, label=round(Rs,2)), geom = "text",则会出现另一个错误Error: Attempted to create layer with no position.你有什么想法吗?非常感谢! - Tunglayer。在 ggplot 2.0.0 上我得到了相同的错误。我更新了答案,使其适用于 ggplot 2.0.0。如果对你不起作用,请让我知道。 - kdauria