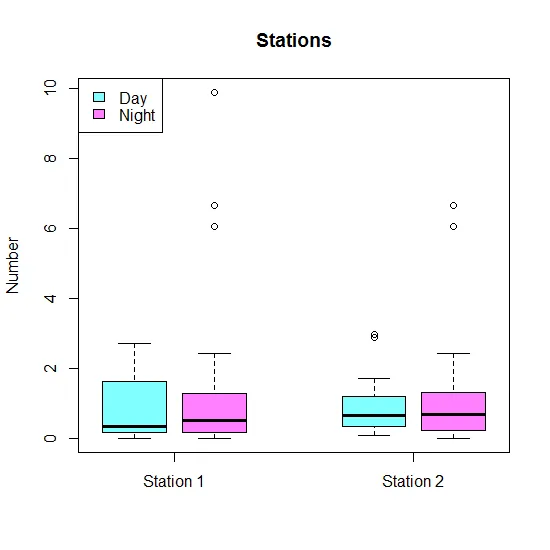
我正在尝试在R中创建成对的箱线图,但不幸的是,它没有起作用:我想为站点1(白天和夜晚)和站点2创建两个箱线图。站点1和2之间应该有一个小间隙。我知道这是一个非常简单的问题,但我在互联网上找不到好的代码。
我希望有人能帮助我。谢谢!这是我的数据:
我希望有人能帮助我。谢谢!这是我的数据:
structure(list(Station = c(1L, 1L, 1L, 1L, 1L, 1L, 1L, 1L, 1L,
1L, 1L, 1L, 1L, 1L, 1L, 1L, 1L, 1L, 1L, 1L, 1L, 1L, 1L, 1L, 1L,
1L, 1L, 1L, 1L, 1L, 1L, 1L, 1L, 1L, 1L, 1L, 1L, 1L, 1L, 1L, 1L,
1L, 1L, 1L, 1L, 1L, 1L, 1L, 1L, 1L, 1L, 1L, 1L, 1L, 1L, 1L, 1L,
1L, 1L, 1L, 1L, 1L, 1L, 1L, 1L, 1L, 1L, 1L, 1L, 1L, 2L, 2L, 2L,
2L, 2L, 2L, 2L, 2L, 2L, 2L, 2L, 2L, 2L, 2L, 2L, 2L, 2L, 2L, 2L,
2L, 2L, 2L, 2L, 2L, 2L, 2L, 2L, 2L, 2L, 2L, 2L, 2L, 2L, 2L, 2L,
2L, 2L, 2L, 2L, 2L, 2L, 2L, 2L, 2L, 2L, 2L, 2L, 2L), time = c("night",
"night", "night", "night", "night", "night", "night", "night",
"night", "night", "night", "night", "night", "night", "night",
"night", "night", "night", "night", "night", "night", "night",
"night", "night", "night", "night", "night", "night", "night",
"night", "night", "night", "night", "night", "night", "day",
"day", "day", "day", "day", "day", "day", "day", "day", "day",
"day", "day", "day", "day", "day", "day", "day", "day", "day",
"day", "day", "day", "day", "day", "day", "day", "day", "day",
"day", "day", "day", "day", "day", "day", "day", "night", "night",
"night", "night", "night", "night", "night", "night", "night",
"night", "night", "night", "night", "night", "night", "night",
"night", "night", "night", "night", "night", "night", "night",
"night", "day", "day", "day", "day", "day", "day", "day", "day",
"day", "day", "day", "day", "day", "day", "day", "day", "day",
"day", "day", "day", "day", "day", "day", "day"), date = c("01.12.2018",
"02.12.2018", "03.12.2018", "04.12.2018", "05.12.2018", "06.12.2018",
"07.12.2018", "08.12.2018", "09.12.2018", "10.12.2018", "11.12.2018",
"12.12.2018", "13.12.2018", "14.12.2018", "15.12.2018", "16.12.2018",
"17.12.2018", "18.12.2018", "19.12.2018", "20.12.2018", "21.12.2018",
"22.12.2018", "23.12.2018", "24.12.2018", "25.12.2018", "26.12.2018",
"27.12.2018", "28.12.2018", "29.12.2018", "30.12.2018", "31.12.2018",
"01.01.2019", "02.01.2019", "03.01.2019", "04.01.2019", "01.12.2018",
"02.12.2018", "03.12.2018", "04.12.2018", "05.12.2018", "06.12.2018",
"07.12.2018", "08.12.2018", "09.12.2018", "10.12.2018", "11.12.2018",
"12.12.2018", "13.12.2018", "14.12.2018", "15.12.2018", "16.12.2018",
"17.12.2018", "18.12.2018", "19.12.2018", "20.12.2018", "21.12.2018",
"22.12.2018", "23.12.2018", "24.12.2018", "01.12.2018", "02.12.2018",
"03.12.2018", "04.12.2018", "05.12.2018", "06.12.2018", "07.12.2018",
"08.12.2018", "09.12.2018", "10.12.2018", "11.12.2018", "12.12.2018",
"13.12.2018", "14.12.2018", "15.12.2018", "16.12.2018", "17.12.2018",
"18.12.2018", "19.12.2018", "20.12.2018", "21.12.2018", "22.12.2018",
"23.12.2018", "24.12.2018"), number = c(0, 0.126103405, 0.25,
0, 0, 0, 0.606060606, 0, 0.238663484, 0, 0.117233294, 0.23255814,
1.156069364, 1.26146789, 9.886363636, 0.789177001, 6.047032475,
6.651884701, 1.321585903, 1.092896175, 0.433369447, 0.215053763,
0.640341515, 2.010582011, 2.415966387, 1.774530271, 0.414507772,
0.513874615, 0.714285714, 0.20242915, 0.201005025, 1.994017946,
1.287128713, 0.68762279, 0, 0.161725067, 0.124481328, 0.25, 0.188284519,
0.062959077, 0, 0, 0.446333688, 0.256136606, 0.321888412, 0.193965517,
0.064935065, 0.260586319, 0.392584515, 0.211267606, 0.066079295,
0.663716814, 1.134593993, 0.067039106, 0.336700337, 0.135440181,
0.884353741, 0.341685649, 0.756013746, 2.002301496, 1.456647399,
1.81184669, 2.453271028, 0.352112676, 2.691853601, 2.206405694,
2.577565632, 2.661870504, 2.171290712, 2.717391304, 0.127064803,
0, 0.25, 0.123915737, 0.789177001, 6.047032475, 6.651884701,
1.321585903, 0.327868852, 1.300108342, 0.64516129, 1.814300961,
0.634920635, 2.415966387, 0.521920668, 0.725388601, 0.205549846,
0.612244898, 1.012145749, 0.100502513, 1.395812562, 0.792079208,
1.178781925, 0, 0.174672489, 0.373443983, 0.25, 1.380753138,
0.769230769, 0.663716814, 1.134593993, 0.067039106, 0.336700337,
0.338600451, 0.612244898, 0.273348519, 0.343642612, 1.242807825,
1.040462428, 0.487804878, 0.911214953, 0.281690141, 0.920897285,
1.28113879, 1.718377088, 2.877697842, 0.579010856, 2.95620438
)), class = "data.frame", row.names = c(NA, -118L))
使用的代码:
#input1 <- "C:\\Users\\test.csv" test <- read.csv(input1, sep=";")
#dput(test)
test$date = as.Date(test$date, format = "%d.%m.%Y")
library(ggplot2)
plot <- ggplot(data = test, aes(x = Station, group=time, y = number)) + geom_boxplot()
print(plot)