ggplot:为连续的x的每个组排列多个y变量的箱线图

18

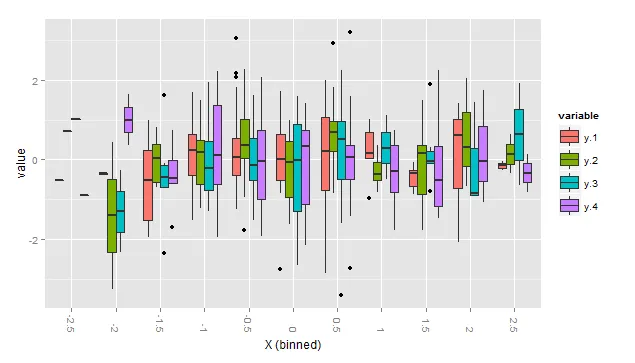
我想为一个连续的x变量的每个组创建多个变量的箱线图。这些箱线图应该在每个x组的旁边排列。

数据看起来像这样:

require (ggplot2)
require (plyr)
library(reshape2)

set.seed(1234)
x   <- rnorm(100)
y.1 <- rnorm(100)
y.2 <- rnorm(100)
y.3 <- rnorm(100)
y.4 <- rnorm(100)

df <- as.data.frame(cbind(x,y.1,y.2,y.3,y.4))

我随后将其熔化

dfmelt <- melt(df, measure.vars=2:5)    

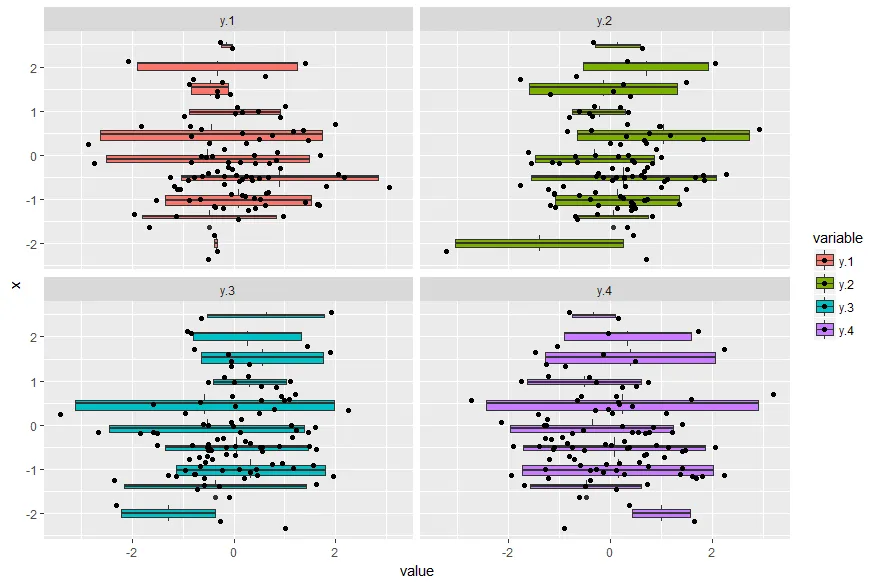
在这个解决方案中展示的facet_wrap(ggplot中按因子绘制多个图表(面板))将每个变量单独呈现在一个图表中,但我希望在一个图表中将每个变量的箱线图并排显示,以便于比较x的不同区间。

ggplot(dfmelt, aes(value, x, group = round_any(x, 0.5), fill=variable))+
geom_boxplot() + 
geom_jitter() + 
facet_wrap(~variable)

fig1

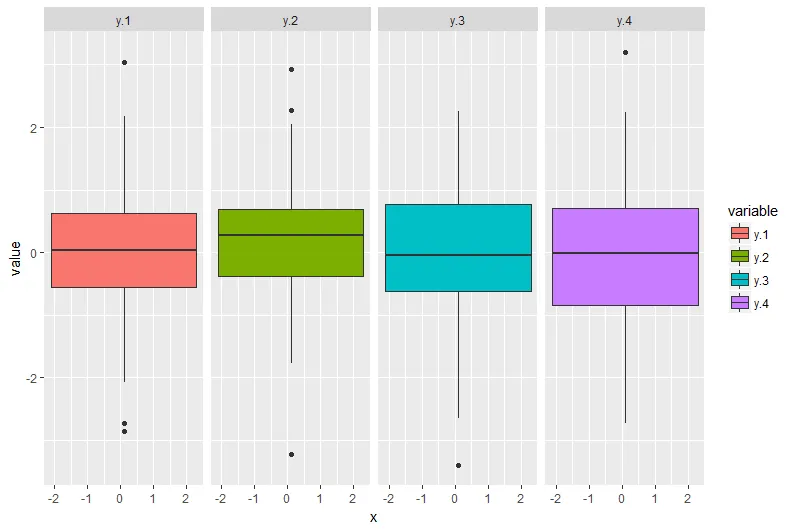
这张图展示了y变量并排,但没有对x进行分组。

ggplot(dfmelt) +
geom_boxplot(aes(x=x,y=value,fill=variable))+
facet_grid(~variable)
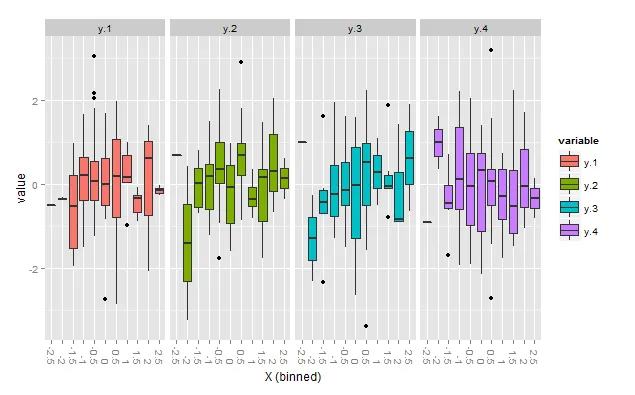
fig2

现在我想为x的每个区间生成这样的图。

需要改变或添加什么?


请在您的代码中包含所使用的库。另外,round_any是从哪里来的? - Tyler Rinker
@TylerRinker - 使用的库为ggplot2和plyr。 - sina
1个回答

34

不太确定您想要什么。这个是否接近您的要求?

在此输入图片描述

library(ggplot2)
library(plyr)
ggplot(dfmelt, aes(x=factor(round_any(x,0.5)), y=value,fill=variable))+
  geom_boxplot()+
  facet_grid(.~variable)+
  labs(x="X (binned)")+
  theme(axis.text.x=element_text(angle=-90, vjust=0.4,hjust=1))

编辑(回复楼上的评论)

您可以通过删除facet_grid(...)调用将每个垃圾桶中的Y放在一起,但我不建议这样做。

ggplot(dfmelt, aes(x=factor(round_any(x,0.5)), y=value, fill=variable))+
  geom_boxplot()+
  labs(x="X (binned)")+
  theme(axis.text.x=element_text(angle=-90, vjust=0.4,hjust=1))

如果必须这样做,使用facets仍然更清晰:

dfmelt$bin <- factor(round_any(dfmelt$x,0.5))
ggplot(dfmelt, aes(x=bin, y=value, fill=variable))+
  geom_boxplot()+
  facet_grid(.~bin, scales="free")+
  labs(x="X (binned)")+
  theme(axis.text.x=element_blank())

请注意,dfmelt 中添加了一个 bin 列。这是因为在 facet_grid(...) 公式中使用 factor(round_any(x,0.5)) 无法正常工作。


这看起来更好,但不是我想要的。对于x的每个bin,我想将相应的y箱线图并排放置(例如x1的y1 | y2 | y3 | y4等)。有任何想法如何实现吗? - sina

网页内容由stack overflow 提供, 点击上面的
可以查看英文原文,
原文链接