如何在matplotlib中给一条线添加标签?

25

我按照文档操作,但仍然无法给一行添加标签。

plt.plot([min(np.array(positions)[:,0]), max(np.array(positions)[:,0])], [0,0], color='k', label='East') # West-East
plt.plot([0,0], [min(np.array(positions)[:,1]), max(np.array(positions)[:,1])], color='k', label='North') # South-North

在上面的代码片段中,我试图绘制出北方和东方的方向。 position 包含要绘制的点。 但最终结果是两条没有标签的直线,如下所示:
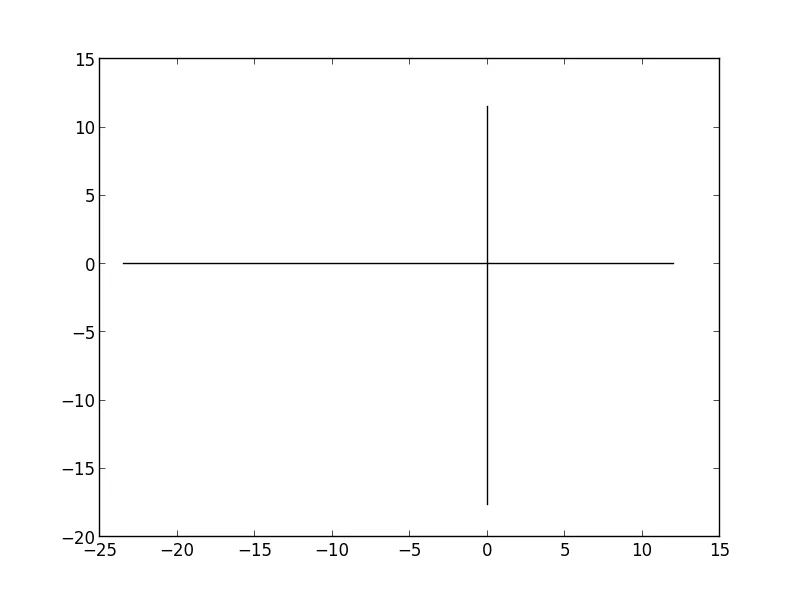
 enter image description here 哪里出错了?

3
据我所知,label参数是用于图例的。您可能希望查看此链接以了解注释的内容:http://matplotlib.org/users/annotations_intro.html - 添加plt.legend()代码后,您将看到标签出现。 - shaunakde
3个回答

49

参数label用于设置在图例中显示的字符串。例如,请考虑以下代码片段:

  import matplotlib.pyplot as plt
  plt.plot([1,2,3],'r-',label='Sample Label Red')
  plt.plot([0.5,2,3.5],'b-',label='Sample Label Blue')
  plt.legend()
  plt.show()

这将绘制如下所示的2条线: Plot With 2 lines

箭头函数支持标签。请查看此链接: http://matplotlib.org/api/pyplot_api.html#matplotlib.pyplot.arrow


4
在添加

0

这应该可以工作:

plt.legend(YourDataFrame.columns)

网页内容由stack overflow 提供, 点击上面的
可以查看英文原文,
原文链接