这张图片展示了我想要实现的效果:
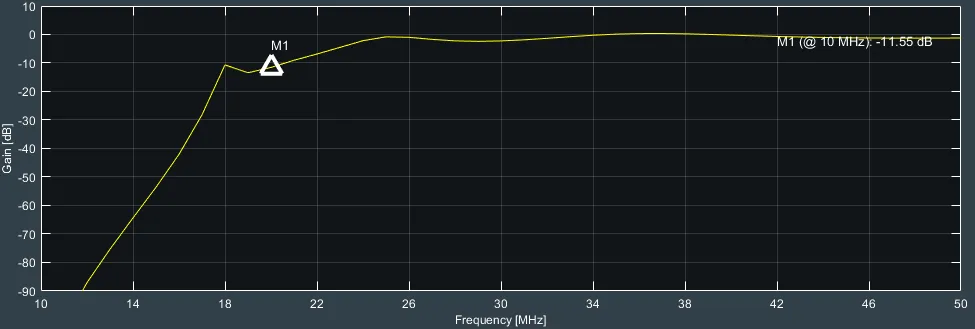
我正在寻找一种方法在matplotlib中添加一个光标到我的曲线上。该光标应该是可拖动的,但只能沿着曲线移动。标签应该显示标记点的实际值。
我不知道该使用哪个对象作为此光标/标记。
这张图片展示了我想要实现的效果:
我正在寻找一种方法在matplotlib中添加一个光标到我的曲线上。该光标应该是可拖动的,但只能沿着曲线移动。标签应该显示标记点的实际值。
我不知道该使用哪个对象作为此光标/标记。
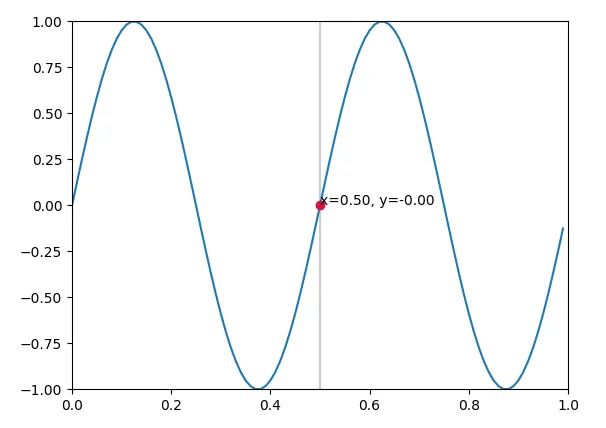
在matplotlib页面上有一个示例,您可以将其调整为显示感兴趣位置的点。
import matplotlib.pyplot as plt
import matplotlib.widgets as widgets
import numpy as np


class SnaptoCursor(object):
    def __init__(self, ax, x, y):
        self.ax = ax
        self.ly = ax.axvline(color='k', alpha=0.2)  # the vert line
        self.marker, = ax.plot([0],[0], marker="o", color="crimson", zorder=3)
        self.x = x
        self.y = y
        self.txt = ax.text(0.7, 0.9, '')

    def mouse_move(self, event):
        if not event.inaxes: return
        x, y = event.xdata, event.ydata
        indx = np.searchsorted(self.x, [x])[0]
        x = self.x[indx]
        y = self.y[indx]
        self.ly.set_xdata(x)
        self.marker.set_data([x],[y])
        self.txt.set_text('x=%1.2f, y=%1.2f' % (x, y))
        self.txt.set_position((x,y))
        self.ax.figure.canvas.draw_idle()

t = np.arange(0.0, 1.0, 0.01)
s = np.sin(2*2*np.pi*t)
fig, ax = plt.subplots()

#cursor = Cursor(ax)
cursor = SnaptoCursor(ax, t, s)
cid =  plt.connect('motion_notify_event', cursor.mouse_move)

ax.plot(t, s,)
plt.axis([0, 1, -1, 1])
plt.show()
indx = min(np.searchsorted(self.x, [x])[0], len(self.x) - 1)防止最后一个点出现超出范围的错误。对于希望用于其他数据的人来说,需要根据数据范围更改(或删除)plt.axis([0, 1, -1, 1])。 - JohanC