fig = plt.figure(0)
rect = [0.1,0.1,0.8,0.8]
theta = np.linspace(0,2*np.pi,12)
line = np.random.rand(5)
r = np.linspace(1,1,12)
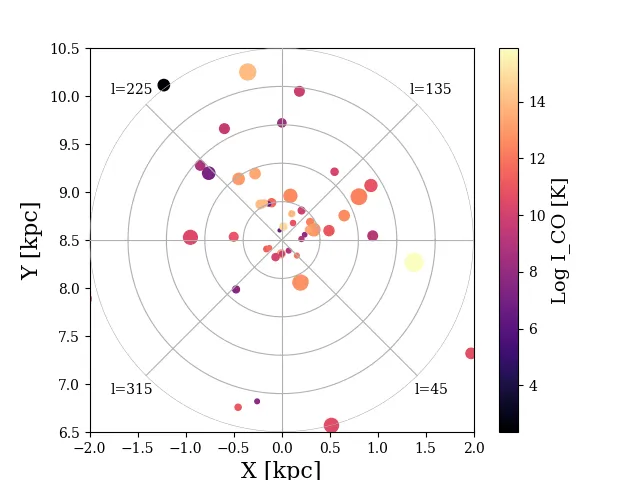
ax_carthesian = fig.add_axes(rect, ylim=(6.5,10.5), xlim=(-2,2), aspect='equal')
ax_carthesian.set_xlabel('X [kpc]')
ax_carthesian.set_ylabel('Y [kpc]')
ax_polar = fig.add_axes(rect, polar=True, frameon=False, xticks=([]), yticks=([]))
ax_polar.set_xticklabels(['','l=135','','l=225','','l=315','','l=45'])
ax_polar.set_yticklabels([])
im = ax_carthesian.scatter(x_stuff, y_stuff, cmap='magma')
ax_polar.grid(True)
bothaxes = [ax_carthesian, ax_polar]
cbar = plt.colorbar(im, ax = bothaxes)
cbar.ax.set_ylabel('Log I_CO [K]')