在Matplotlib中给子图添加标签

7
有没有自动将纯标签添加到子图中的方法?具体来说,我使用了
ax1 = fig.add_subplot(121)
ax2 = fig.add_subplot(122)

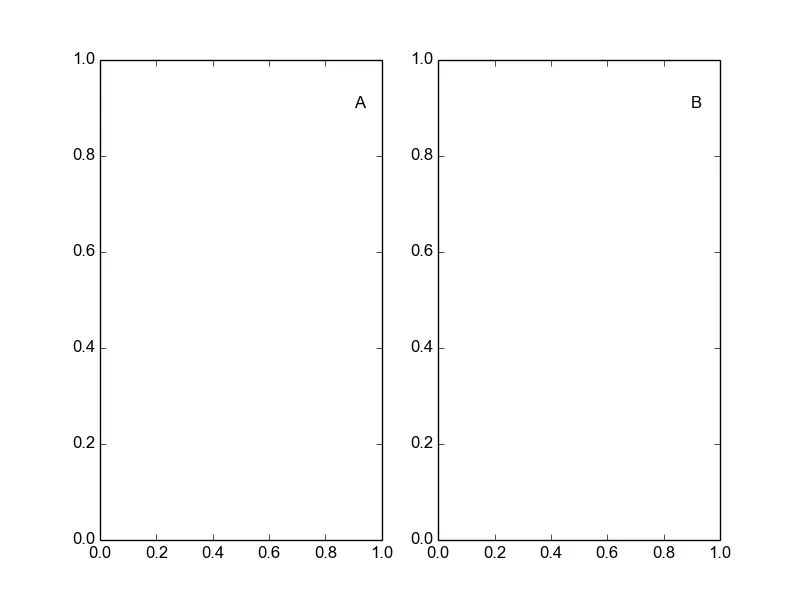
我希望在子图的右上方添加“A”和“B”以区分它们,目前我正在使用某种虚拟方法,类似于:

ax1.annotate('A', xy=(2, 1), xytext=(1, 22))
ax2.annotate('B', xy=(2, 1), xytext=(1, 22))

我尝试使用

ax1.legend()

这也给我带来了字母前的“小图像”,通常是线条或点,但我不需要这个图像。


这部分matplotlib用户指南可能会很有帮助:http://matplotlib.org/users/transforms_tutorial.html#axes-coordinates - cel
4个回答

9
您可以跳过编写辅助函数的步骤,直接调用以下代码:
ax1 = fig.add_subplot(121)
ax2 = fig.add_subplot(122)

ax1.annotate("A", xy=(0.9, 0.9), xycoords="axes fraction")
ax2.annotate("B", xy=(0.9, 0.9), xycoords="axes fraction")

9

您可以使用annotate命令,但需要将限制正确设置为“右上角”。如果在制作所有绘图后调用annotate命令,则应该可以正常工作,因为它会从轴本身提取限制。

import pylab as plt

fig = plt.figure()
ax1 = fig.add_subplot(121)
ax2 = fig.add_subplot(122)

def get_axis_limits(ax, scale=.9):
    return ax.get_xlim()[1]*scale, ax.get_ylim()[1]*scale

ax1.annotate('A', xy=get_axis_limits(ax1))
ax2.annotate('B', xy=get_axis_limits(ax2))
plt.show()

输入图片描述

同时值得一提的是,还有其他方法可以将文本放置在图形上。


1
我刚刚在我的代码中添加了更多的参数 def get_axis_limits(ax, x_scale=.7, y_scale=0.7),这可能会提供更多的自由。@Hooked - GeauxEric

0

hooked 的回答是正确的,但要记得需要适当地缩放位置。

def text_coords(ax=None,scalex=0.9,scaley=0.9):
  xlims = ax.get_xlim()
  ylims = ax.get_ylim()
  return {'x':scalex*np.diff(xlims)+xlims[0],
        'y':scaley*np.diff(ylims)+ylims[0]}


scalex = [0.02,0.02,0.75,0.75]
scaley = [0.02,0.75,0.02,0.75]
labels = ['(a)','(b)','(c)','(d)']

f,ax = plt.subplots(2,2)
for sx,sy,a,l in zip(scalex,scaley,np.ravel(ax),labels):
   a.text(s=l,**text_coords(ax=a,scalex=sx,scaley=sy))
plt.tight_layout()
plt.show()

标签演示


0
Matplotlib(版本3.4.2)有一个函数可以帮助解决此问题:{{link1: pyplot.subplot_mosaic }}。
请参见这里的示例,演示如何生成以下内容:{{link3:enter image description here}}。

网页内容由stack overflow 提供, 点击上面的
可以查看英文原文,
原文链接